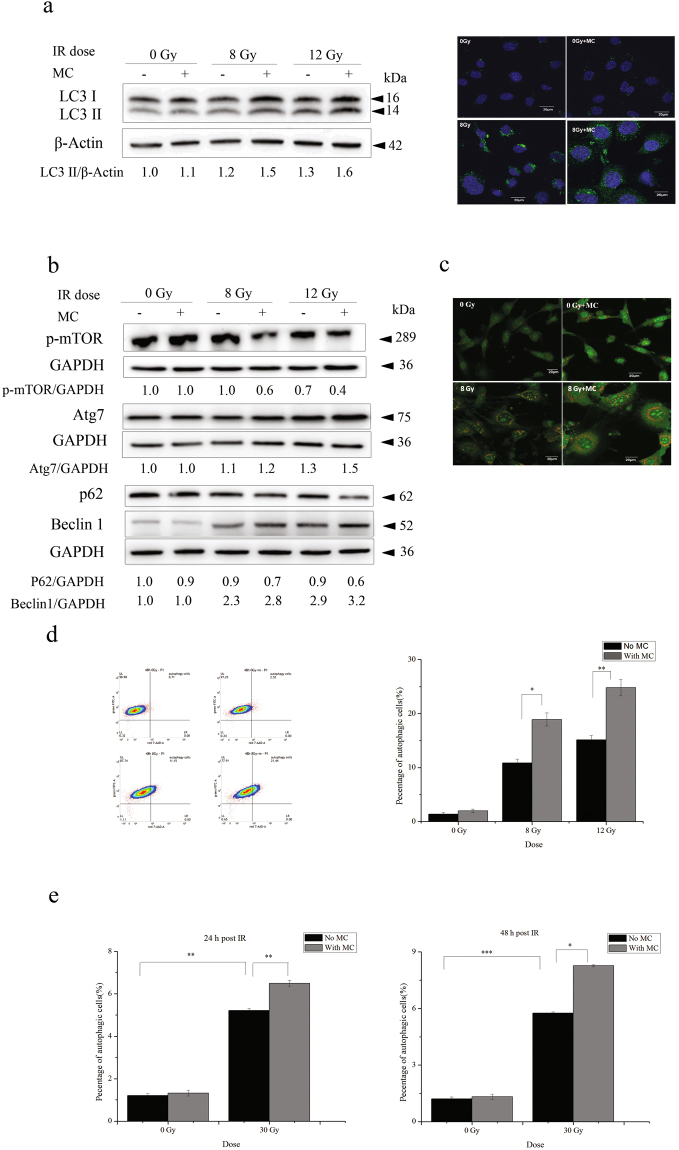
Figure 4.
Minocycline enhanced radiation-induced autophagy in HT22 cells and primary neurons. (a) The representative immunoblots (left panel) and immunofluorescence images (right panel) depicting the expression levels of LC3 II. Cells irradiated in the presence or absence of minocycline were collected and lysed 48 h after radiation, the expression levels of LC3 was detected by western blot. LC3 and β-actin were probed from different parts of the same PVDF membrane; Cells were fixed 48 h post IR and immunostained with LC3 II antibodies, and observed under a fluorescent microscope. (b) The representative immunoblots of other autophagy markers such as p-mTOR, Atg7, p62 and Beclin 1. Cells irradiated in the presence or absence of minocycline were collected and lysed 48 h after radiation, the expression of the autophagy markers were detected by western blot. As shown in Fig. 4b, the proteins and the corresponding loading controls were probed from different parts of the same PVDF membranes. Among them, p62 and Beclin1 were probed on the same part of membrane after stripping. (c) The representative fluorescence images of AO staining in HT22 cells with different treatments. Cells were stained with AO 48 h post IR, and observed under a fluorescent microscope. (d) The representative histogram for AO staining in HT22 cells with different treatment (left panel) and quantification of autopahgic cells in irradiated cells with and without minocycline (right panel). Forty-eight hours post IR, cells were stained with AO, and analyzed by flow cytometry. (e) Quantification of autopahgic cells in irradiated primary neurons with and without minocycline 24 and 48 h post IR. Primary neurons treated differently were stained with AO 24 and 48 h post IR, and analyzed by flow cytometry. *P < 0.05, **P < 0.01 and ***P < 0.001 compared with the relative control, respectively.

