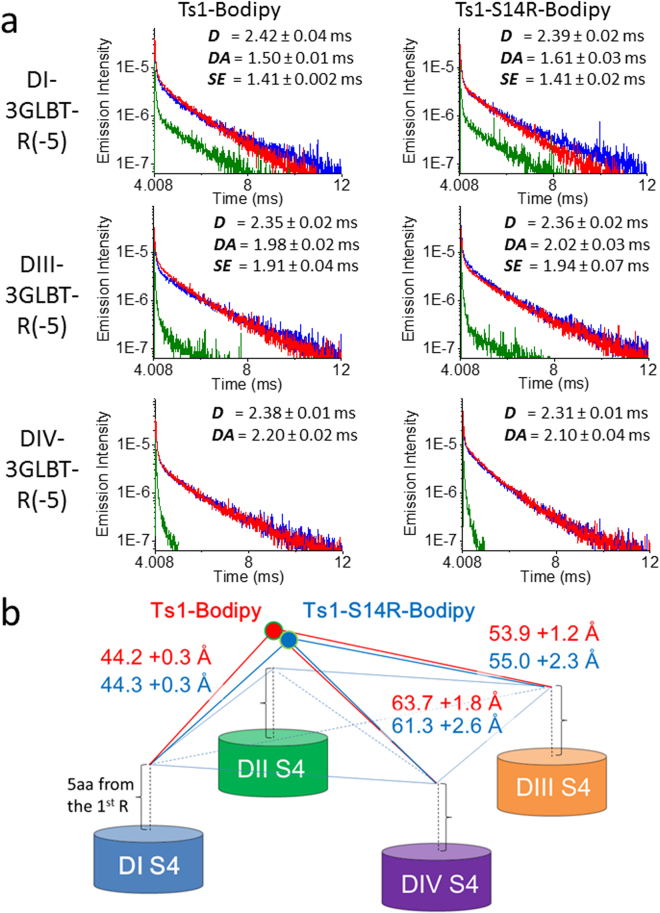
Figure 5.
Distance measurements between Nav-LBTs and Ts1-Bodipy or Ts1-S14R-Bodipy by LRET. (a) Representative raw traces of donor signal (D: blue), donor in presence of acceptor signal (DA: red) and sensitized emission signal (SE: green) of Nav-LBTs and Ts1-Bodipy (left column, DI-3GLBT-R(-5): n = 5; DIII-3GLBT-R(-5): n = 6; and, DIV-3GLBT-R(-5): n = 4; adapted from Kubota T. et al.21), or Ts1-S14R-Bodipy (right column, DI-3GLBT-R(-5): n = 8; DIII-3GLBT-R(-5): n = 6: and, DIV-3GLBT-R(-5): n = 5). Time constants are shown as average values ± SEM. (b) Schematic structural map of the location of Ts1-Bodipy (red circle) and Ts1-S14R-Bodipy (blue circle) in Nav1.4, based on LRET measurements. Distance values of Ts1-Bodipy were adopted from Kubota T. et al.21. Distances are average values ± SEM calculated from the time constants.

