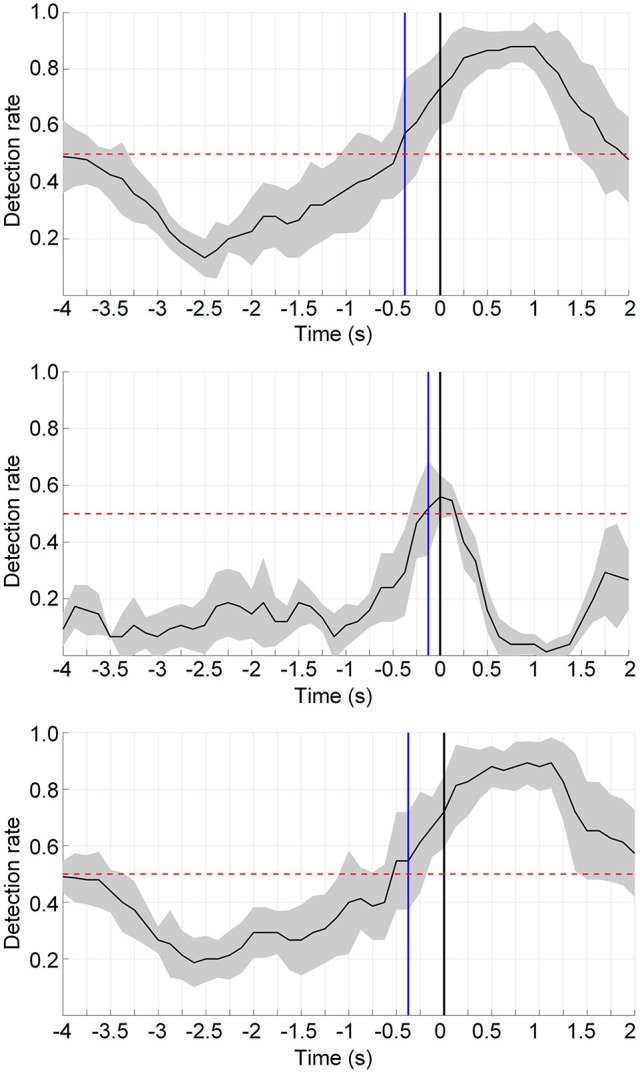
Figure 5.

Single-trial detection performance using the MRCP-based method (upper), the SMR-based approach (middle), and the concatenate model combining MRCPs and SMRs (lower) from a typical subject (s10). The detection was performed from −4 to 2 s with respect to the actual movement onset. The blue lines display the detection points when consecutive 3 samples have a detection rate significantly above the chance level (p < 0.05). The chance level is shown in red dashed lines. The black curves and gray regions depict the mean and standard deviation of the detection rate.
