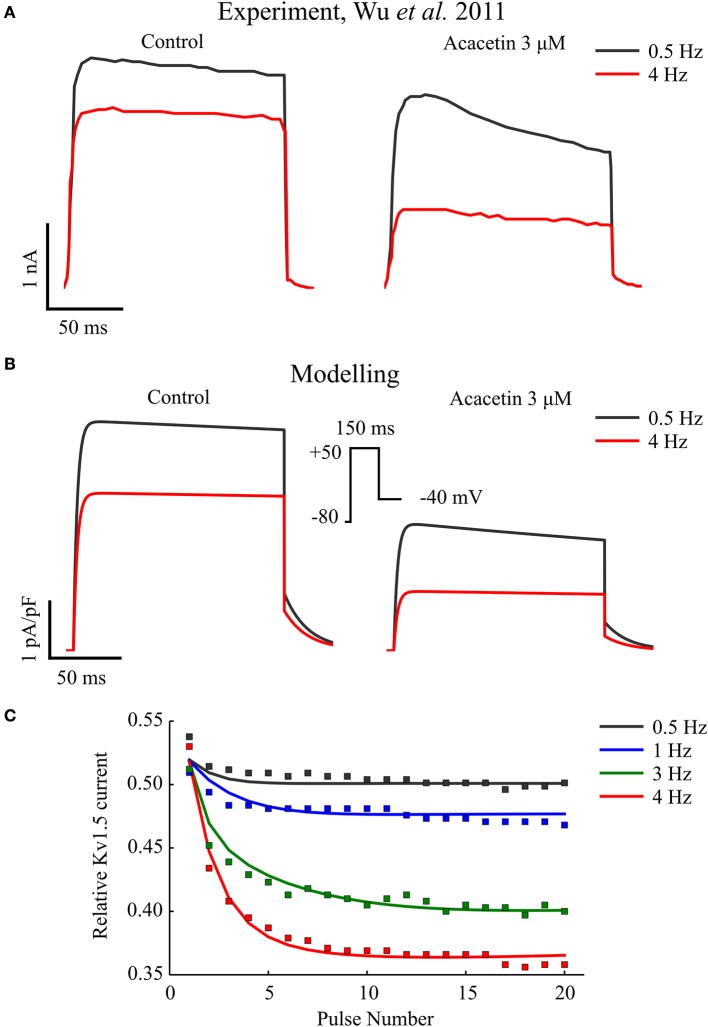
Figure 1.
Frequency-dependent inhibition of IKur by acacetin. (A) Experimental and (B) simulated traces of KV1.5 channel current elicited from the 20th voltage step repeating at 0.5 and 4 Hz in control (left) and after exposure to 3 μM of acacetin (right). (C) Relative remaining IKur following application of acacetin at various frequencies plotted against the pulse number of the voltage step. The simulated data (lines) were compared with experimental values (squares). The relative fraction was obtained by normalizing the end-step current measured from each pulse following application of acacetin to that of control. Experimental data were digitalized from Wu et al. (2011).

