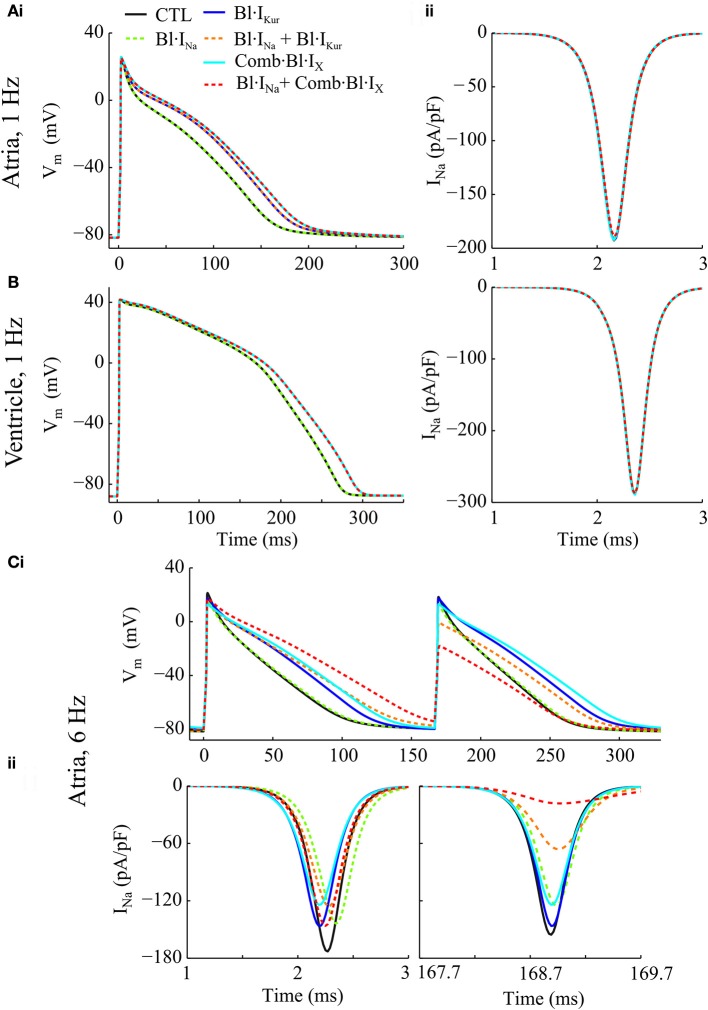
Figure 3.
Simulated AP and INa traces of cAF-remodeled atrial myocytes and ventricular cells in response to Na+- and K+- block regimens. (Ai) APs from cAF-remodeled atrial myocytes paced at 1 Hz; (Aii) Time courses of corresponding INa during the upstroke phase. (B) Simulated time courses of AP and INa of a ventricular cell paced at 1 Hz. (C) Illustration of (i) APs and (ii) the corresponding time courses of INa of a cAF-remodeled myocyte paced at 6 Hz. In these simulations, rate constants for INa blocker were: KA = 100 ms−1· M−1, KI = 100 ms−1· M−1, IA = 1 ms−1, II = 0.01 ms−1.

