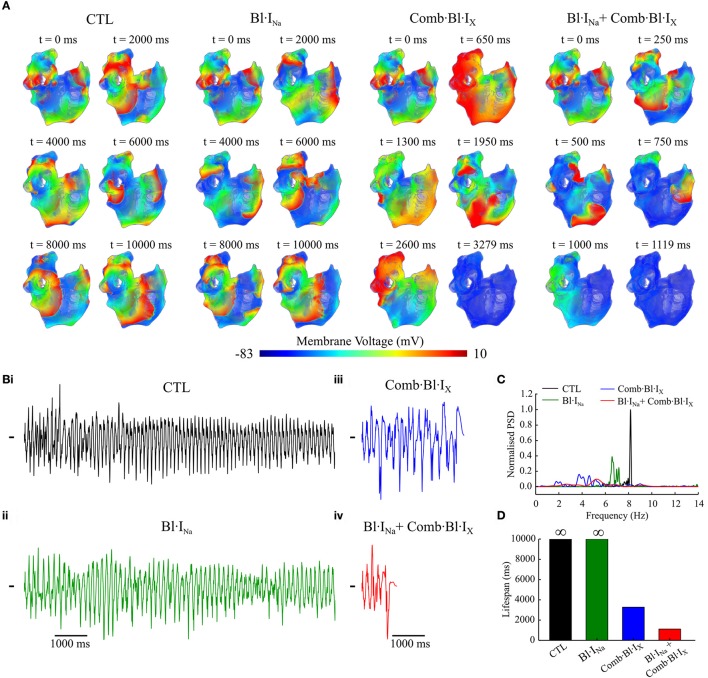
Figure 9.
Simulated re-entrant excitations computed using the 3D anatomical model of the cAF-remodeled human atria in response to application of channel blockers as compared to that of the drug-free (CTL) condition. (A) Snapshots of electrical excitation waves. Drugs were applied at t = 0 ms. (B) Simulated pECGs. (C) Power spectrum density (PSD) obtained from the pECGs. PSDs were normalized to the maximum value of that in control. (D) Lifespan of re-entrant excitations in these simulated atria for various conditions. The symbol ∞ indicates the spiral waves were sustained throughout the 10-s episode of simulation. ;M, M.

