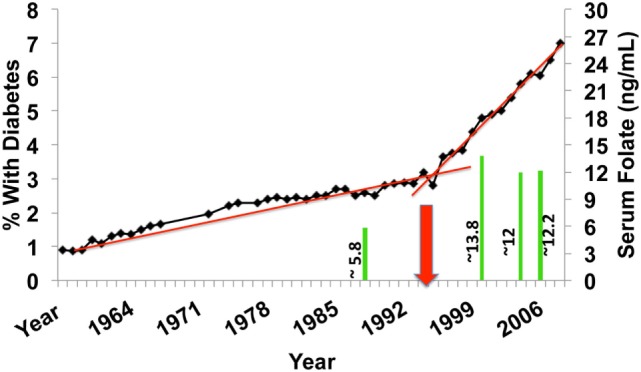
Figure 2.

U.S. incidence of diabetes over the past 50 years (type 1 diabetes and T2D) expressed as % of total population. The red arrow depicts the initiation point of mandatory fortification of flour products with folic acid. The green bars are measurements of serum folate levels from NHANES subjects of the corresponding years.
