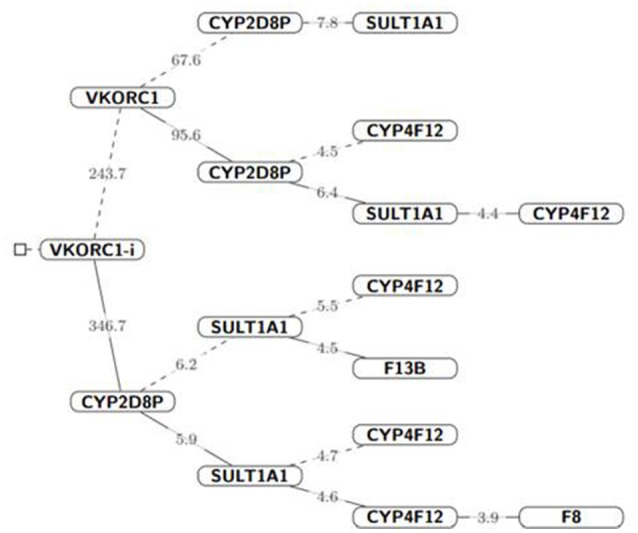
Figure 2.

Hierarchical tree of variants influencing acenocoumarol dose. The parent node (solid lines) represent gene variants from which other variants depend for acenocouumaorl dose estimation, i.e., all probability statement in that branch are conditioned to the probabilistic event of the parent node (gene) Iparent = 1, dashed lines indicate that the parent node was conditioned to zero, Iparent = 0. The number on each line represents the Bayes Factor for the following branched off node; given the cut-off values. For visualization purposes, we did not condition on CYP2D8P, which was strongly associated with high-dose values (≥40 mg/wk) in 3 of the 6 patients receiving high doses. Nevertheless, both frequentist and Bayesian hypothesis testing suggested a strong association to coumarin dose for this variant (P-value < 0.05 and Bayes Factor > 100, respectively).
