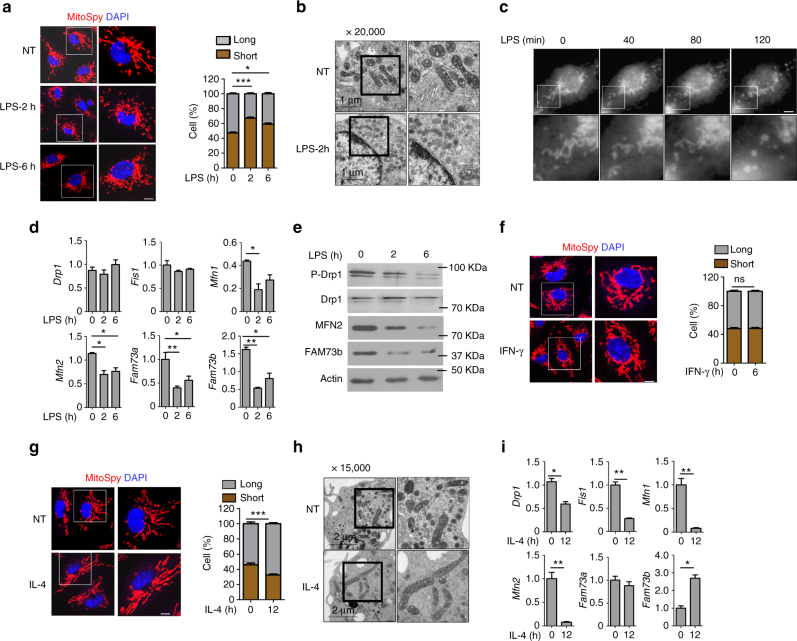
Fig. 1.
FAM73b controls mitochondrial morphology. Primary BMDMs treated with LPS (500 ng/ml) at the indicated time points. Mitochondria were visualized using MitoSpyTM Orange CMTMRos staining. Representative confocal images of the mitochondrial morphology are shown, and quantification was analyzed with Image-Pro and presented as a bar graph (a). The data are shown as the mean ± SEM of three independent experiments, with 100 cells counted for each replicate; colors indicate the mitochondrial morphology (long or short). b The mitochondrial morphology of WT BMDMs was analyzed with EM (scale bar, 1 μm). c Time-lapse images of WT BMDMs treated with LPS (500 ng/ml) and stained with MitoSpyTM Orange CMTMRos. d, e qRT-PCR and IB analyses of the indicated genes using LPS-stimulated BMDMs from WT mice. f Representative confocal images and bar graph of WT BMDMs stimulated with IFN-γ (10 ng/ml) for 12 h. (g, h) WT BMDMs stimulated with IL-4 (20 ng/ml) for 12 h. Representative confocal (g) and EM (h) images are presented. i The indicated genes were measured with qRT-PCR. All qRT-PCR data are presented as fold-induction relative to the Actb mRNA level. All the data are representative of three independent experiments. Scale bars in a, c, f and g are 5 μm; one in b is 1 μm; one in h is 2 μm. Error bars are the mean ± SEM values. Two-tailed unpaired t-tests were performed. *P < 0.05; **P < 0.01

