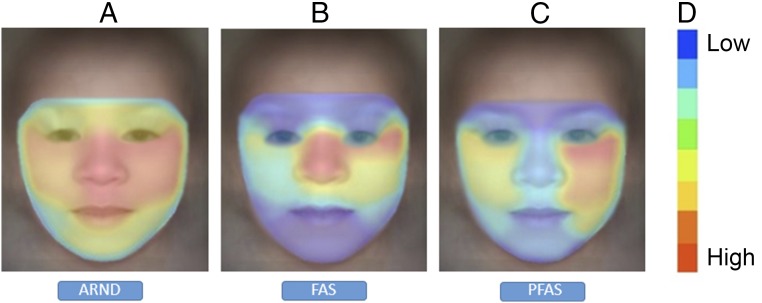
FIGURE 4.
Heatmap comparison of FASD showing all regions of the face provide cues supporting ARND classification; in FAS and PFAS, only few regions that correspond to the cardinal facial features support the diagnosis of FASD. The images show regions supporting classification of A, ARND; B, FAS; and C, PFAS. D, Correlation scale.

