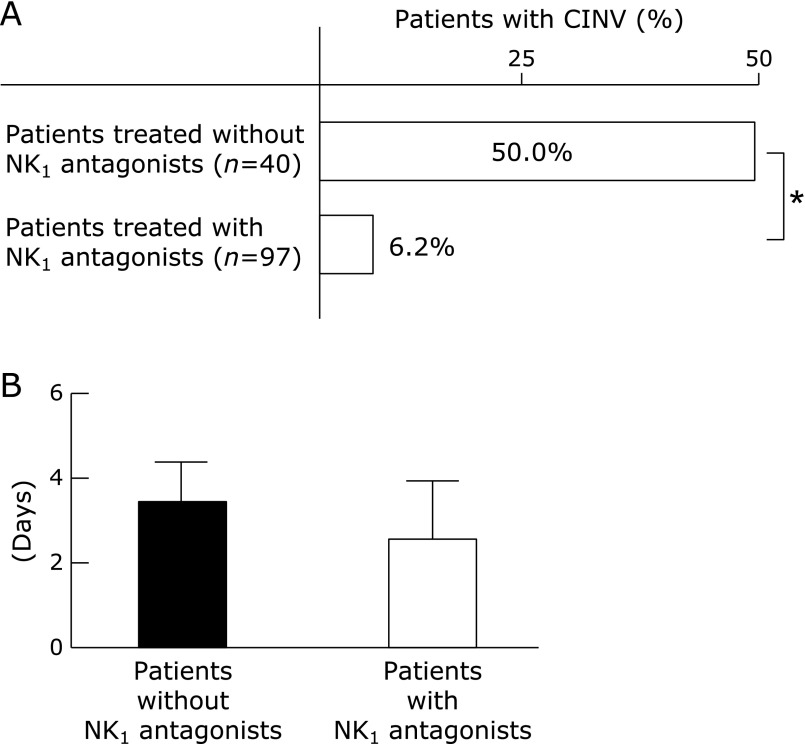
Fig. 2.
(A) Percentages of CINV in patients with NK1 antagonist or without after TACE or HAIC. The Pearson’s chi-square test was used to compare the percentages in each group. *p<0.05. (B) Average duration of CINV in HCC patients by treatment group. The Mann-Whitney U test was used to compare the average duration in each group.

