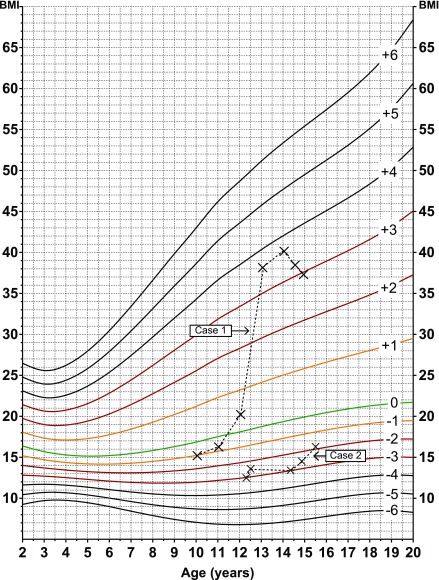
FIGURE 4.
Two to 20 years: female patients, continued. BMI-for-age z scores calculated by using the modified BMI z score. The BMI of a female patient (Case 1) who transitioned from having normal weight to having severe obesity between the ages of 10 to 14 years was plotted by using a modified BMI-for-age z score chart, and the BMI of a female patient (Case 2) with underweight problems was plotted by using a modified BMI-for-age z score chart.

