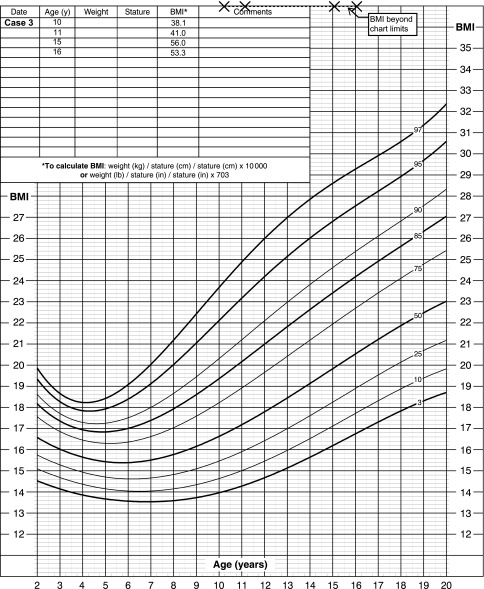
FIGURE 5.
Two to 20 years: male patient. BMI-for-age percentiles. Shown here are the BMI plots of a male patient (Case 3) with severe obesity who demonstrated an improvement in BMI that could not be tracked by using the CDC 2000 BMI-for-age-sex growth chart. Source: developed by the National Center for Health Statistics in collaboration with the National Center for Chronic Disease Prevention and Health Promotion (http://www.cdc.gov/growthcharts).

