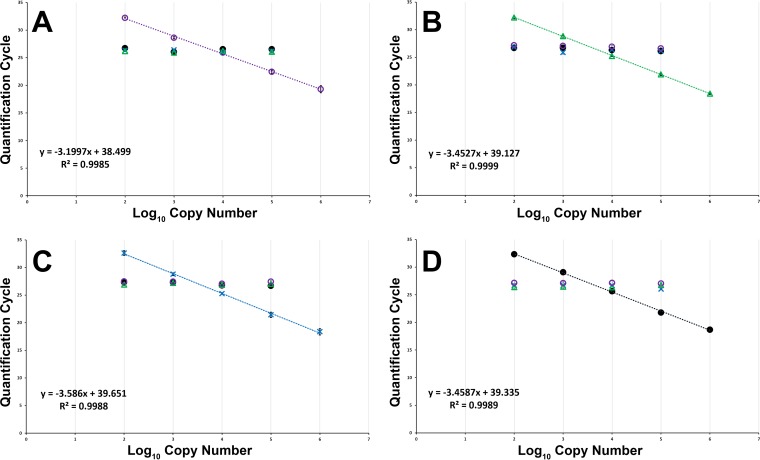
FIG 4.
Mean quantification cycles (Cq) for known serial 10-fold dilutions of E. anguillarum (○) (A), E. ictaluri (△) (B), E. piscicida (×) (C), and E. tarda (●) (D). A dilution series for each assay was performed in the presence of an equal mixture of ∼10,000 copies of each nontarget Edwardsiella sp. gDNA. Error bars indicate standard deviations generated from samples run in triplicate on 3 separate plates. The user-defined baseline threshold for Cq determination was set at 50 relative fluorescence units for all runs.

