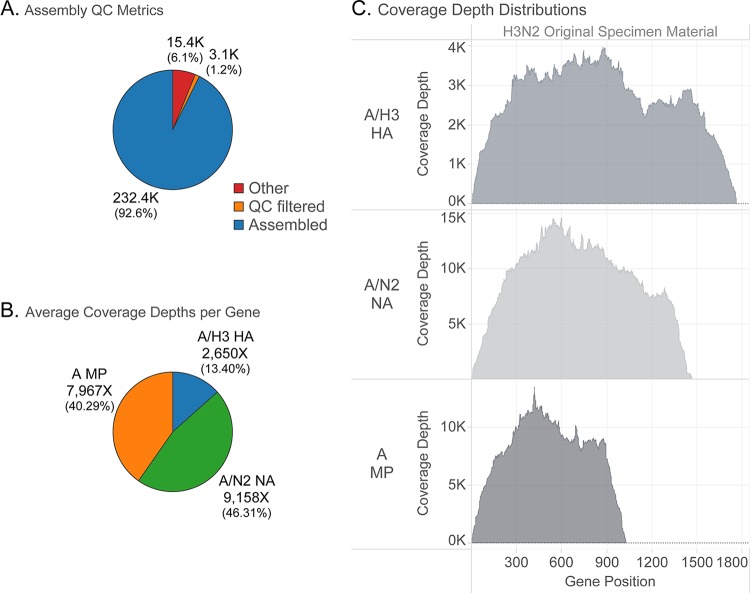
FIG 4.
NGS analysis results generated from IRMA. Influenza virus samples processed at the CDC were sequenced on the Illumina MiSeq platform, and data were analyzed using the IRMA pipeline. Representative graphs of an influenza A virus are shown for the percentage of read counts and the sequencing coverage and depth. (A) Percentages of total read counts. Assembled, influenza virus reads in final assemblies; quality control (QC) filtered, did not pass length/median quality thresholds; other, nonflu, and contaminant/poor flu signal. (B) Percentages of assembled, merged-pair read counts of influenza virus HA, NA, and M segments. (C) Sequencing coverage and depth based on the reads mapped to the HA, NA, and M segments.

