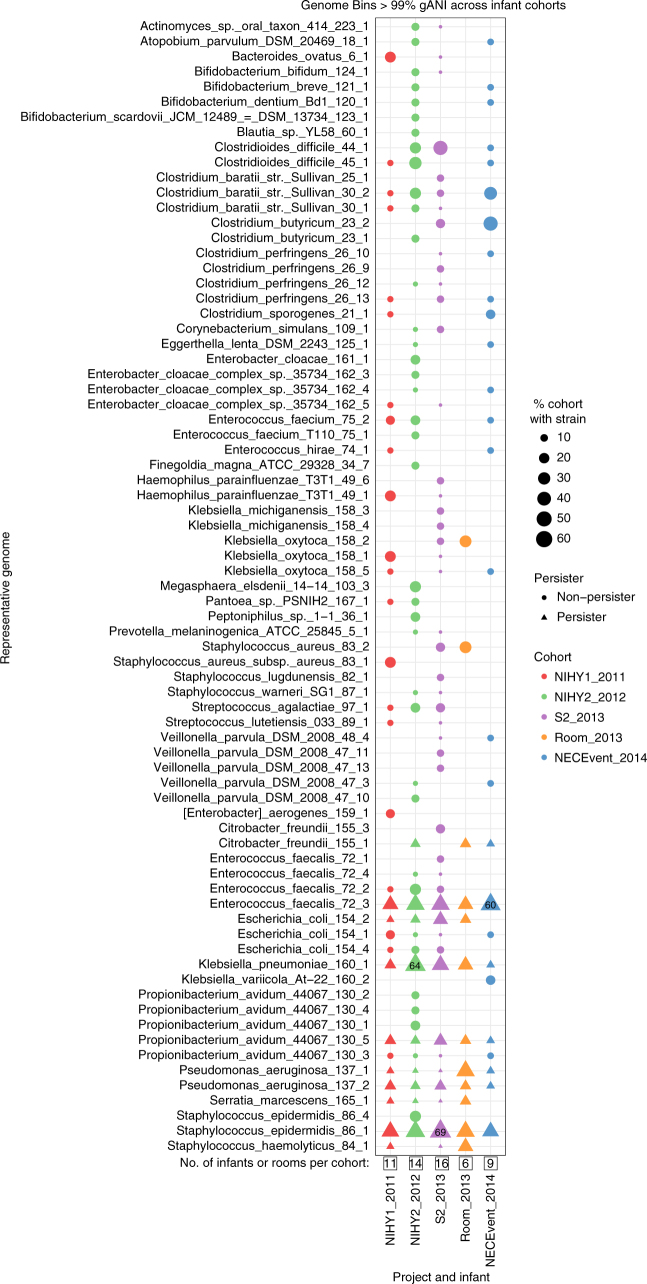
Fig. 1.
Subspecies found in the infant gut across several cohorts and years are also present in rooms. Fecal (columns 1, 2, 3, and 5) and room (column 4) samples from defined sampling time periods (the 2011, 2012, 2013, and 2014 cohorts) are arrayed on the x axis. Dots indicate the percent of infants, or rooms for column 4, in each cohort that contain a given subspecies (the top three highest percentages are labeled for clarity). The y axis labels indicate a representative genotype from clusters of genotypes that share > 99% gANI. The first digit in the name indicates the species and the second indicates the specific subspecies. See Supplementary Data 3–11 for further genome-clustering results. Only genomes that were found across different cohorts or in both an infant and a room are displayed. Triangles indicate organisms classified as persistent taxa (“persisters”) because they appear in the room and in infant cohorts more than 1 year apart

