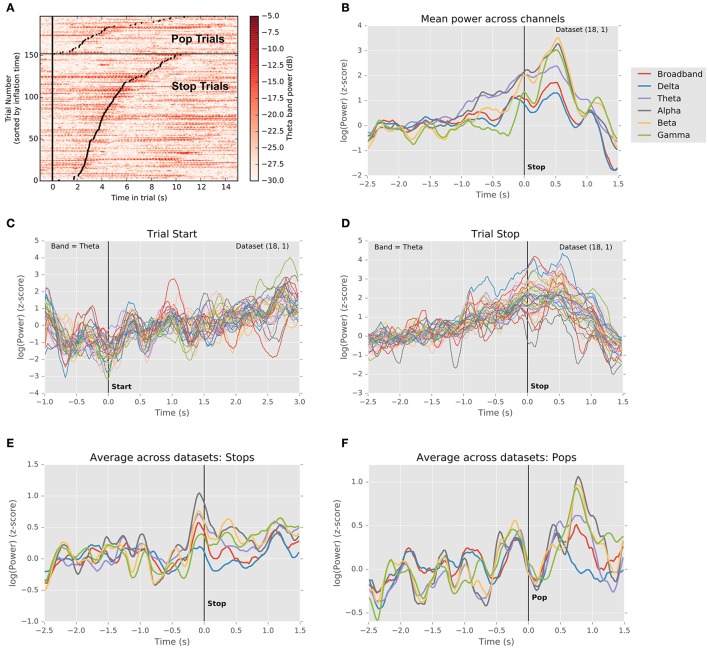
Figure 3.
Changes in local field potential over the course of the trial. (A) Raster plot of power in the theta frequency range (4–8 Hz) for each trial in a single dataset (18.1). Each line represents one trial, with trials ordered vertically by duration. Successful stops are plotted below unsuccessful stops (balloon pops). Left vertical black line indicates trial start. Black dots indicate trial stops. Color indicates theta-band power in dB. A clear increase in theta power precedes successful stops. (B) Normalized LFP power rises preceding stops. Traces depict mean (across channels) of medians (across successful stop trials) LFP power in delta, theta, alpha, beta, and gamma frequency bands, as well as broadband signal, aligned to the time of the stop (t = 0). Power in theta band rises preceding the stop, falling gradually thereafter, whereas power in alpha and beta bands dips prior to the stop, rises sharply thereafter, and falls abruptly during the outcome period. (C) Normalized theta band LFP power in each channel aligned to trial start (t = 0). Traces indicate medians across trials (one trace per channel). Theta power dips just prior to trial onset and begins to rise as the balloon inflates. (D) Normalized theta band power in each channel aligned to trial stop. Traces represent medians across successful stop trials (one trace per channel). Power increases until the stop, following which it declines toward its pre-trial baseline. (E) Grand mean (averaged across datasets) trajectory of power in different frequency bands preceding voluntary stops (t = 0). Conventions are as in (A). Note that multiple frequency bands exhibit changes in power preceding stops. (F) Grand mean (averaged across datasets) trajectory of power in different frequency bands preceding involuntary stops (i.e., pops; t = 0). Conventions are as in (A). Note the sharp rise in power during the outcome phase, similar to the rise in power preceding voluntary stops.

