Figure 4.
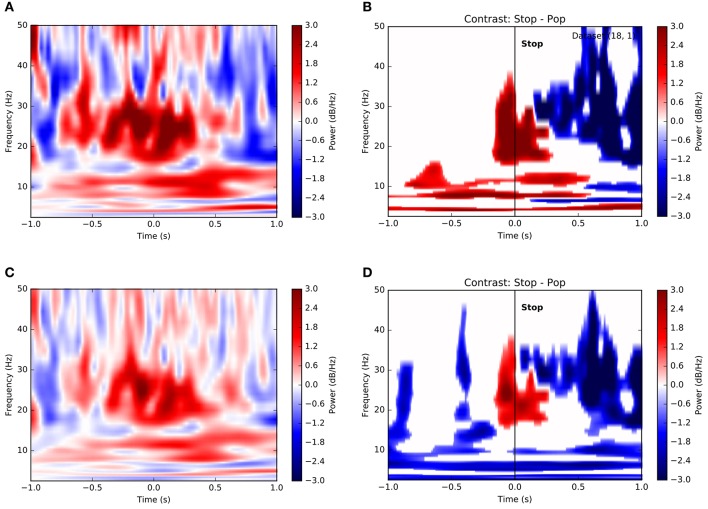
Time-frequency contrasts show dissociable roles for different frequency bands in stopping. (A) Time-frequency plot of power on successful stop trials aligned to time of stop (t = 0) for a single subject. Color depicts change normalized change in power relative to pre-trial baseline in decibels (see Methods). Increases in both low-frequency power and beta band activity precede the stop. (B) Significance-thresholded time-frequency contrast plot depicting differences in power between successful and unsuccessful stop (pop) trials for a single subject. Conventions and subject are as in (A). Clusters represent statistically significant changes in activity between conditions (see Methods). Here again, voluntary stop decisions are marked by early increases in low-frequency power and peri-stop increases in beta band power more proximal to movement. (C) Equivalent of (A) using all trials across all subjects. (D) Equivalent of (B) using all trials across all subjects.

