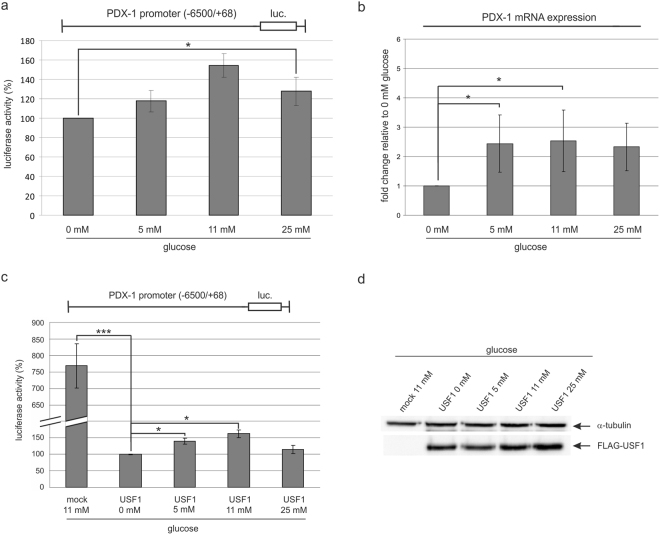
Figure 3.
Influence of glucose on the transcription of the PDX-1 promoter of INS-1 cells. (a) INS-1 cells were transfected with the PDX-1 promoter construct −6500/+68-STF-luc and starved overnight. The next day, cells were treated with 0 mM, 5 mM, 11 mM or 25 mM glucose and harvested after a period of 4 h. Luciferase activity was determined in triplicate; the activity in the cells treated with 0 mM glucose was set to 100%. Statistical analysis was performed by using Students t-test. *Significant difference p < 0.05. (b) INS-1 cells were starved overnight and the next day treated with 0 mM, 5 mM, 11 mM or 25 mM glucose and harvested after a period of 24 h for mRNA isolation with TRIzol® Reagent. PDX-1 mRNA levels were detected semi-quantitatively by real-time RT-PCR. Fold change of PDX-1 mRNA expression relative to 0 mM glucose is displayed (mean ± SD, n = 3). (c) INS-1 cells were transfected with the PDX-1 promoter construct −6500/+68-STF-luc and the USF1 expression plasmid. After overnight starvation, cells were treated with 0 mM, 5 mM, 11 mM or 25 mM glucose and harvested after a period of 4 hours. Luciferase activity was determined in triplicate; the activity in the 0 mM glucose treated cells was set to 100%. Statistical analysis was performed by using Students t-test. *Significant difference p < 0.05. (d) The corresponding Western blot analysis of the FLAG-tagged USF1 is shown beside the graph. Identification of FLAG-tagged USF1 was performed with the mouse monoclonal antibody FLAG M2 (F1804), and α-tubulin served as a loading control. Full-length blots are presented in Supplementary Figure S2.

