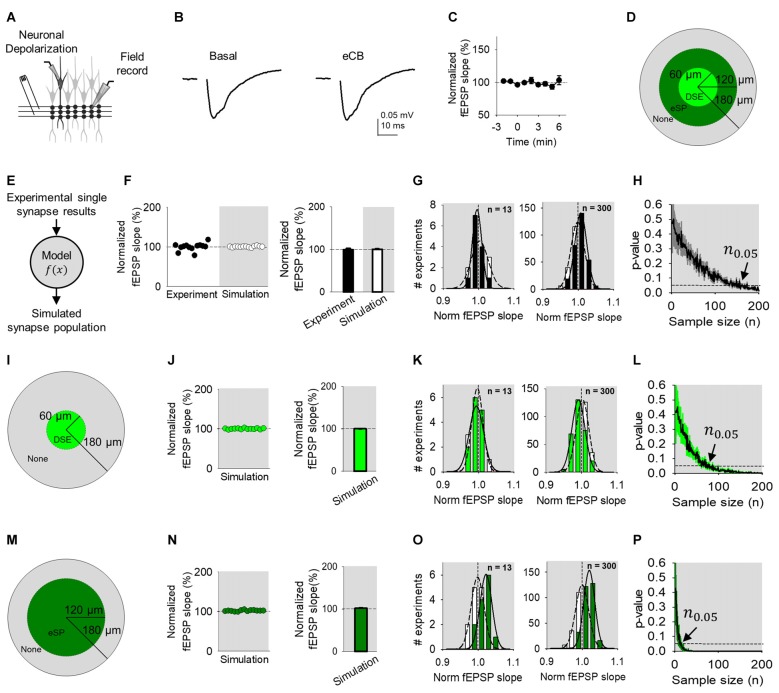
Figure 4.
eCB-mediated synaptic regulation is undetected in Field recordings. (A) Scheme representing a whole-cell recorded CA1 pyramidal neuron, extracellular electrode recording fEPSPs and SC bulk stimulation. (B) Average fEPSP traces before (basal) and after ND of the whole-cell recorded neuron to stimulate eCB release (eCB). (C) Relative fEPSP slope (from basal) vs. time. Zero time indicates eCB release by ND. (D) Modulation topology of synapse population. (E) Monte Carlo scheme of synapse population using single synapse data. (F) Individual experimental and simulated data of relative fEPSP slope (from basal) after ND-evoked eCB release. (G) Simulated distributions normalized slope of baseline (white) with modulated (black) data for n = 13 (left) and n = 300 (right). (H) Computational model-predicted p-value vs. sample size. (I) Modulation topology of synapses undergoing DSE-only. (J) Simulated fEPSP slope data of DSE-only. (K) Simulation distributions of DSE-only normalized slope baseline (white) and modulated (green) data for n = 13 (left) and n = 300 (right). (L) Computational model-predicted p-value vs. sample size for synapses undergoing DSE-only. (M–P) As (I–L), but for synapses undergoing eSP-only. Data are represented as mean ± SEM.

