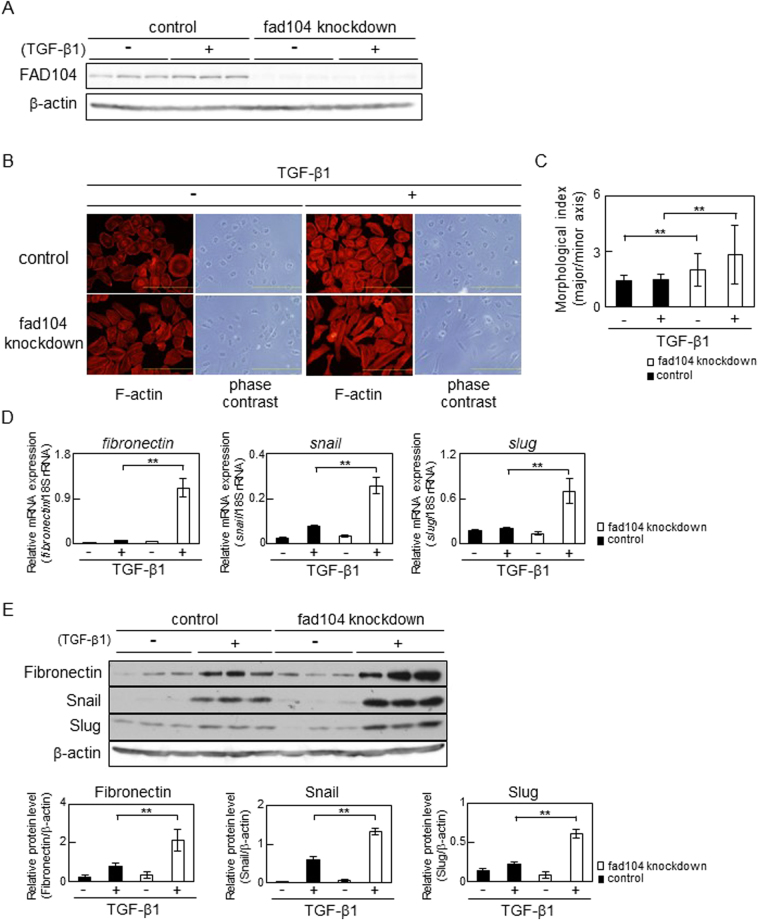
Figure 3.
Fad104 knockdown enhances TGF-β–mediated EMT in HeLa cells. (A) Knockdown efficiency of fad104 in HeLa cells. HeLa cells were transfected with siRNA targeting fad104 (sifad104-A) and treated with 5 ng/mL TGF-β1. Luciferase siRNA was used as a control. β-Actin expression was used as a loading control. (B) Morphological changes in HeLa cells transfected with fad104 siRNA. Cells were treated with 5 ng/mL TGF-β1 for 72 h. F-actin was visualized by TRITC-conjugated phalloidin. Scale bars represent 100 μm. (C) Quantitative analysis of cell morphology of HeLa cells in (B). The lengths of the major and minor cell axes were measured using NIH-Image software. The ratios of the major to minor axes of cells were used to determine the degree of elongated cell morphology. For each experiment, over 20 cells in each condition were measured. Each column represents the mean with standard deviation. (D) qPCR analysis of fibronectin, snail, and slug expression in fad104 knockdown cells. Cells were treated with 1 ng/mL TGF-β1 for 72 h. Expression levels of fibronectin, snail, and slug were normalized with 18 S rRNA expression. Each column represents the mean with standard deviation (n = 3). (E) Protein expression of fibronectin, Snail, and Slug in fad104 knockdown cells. Whole-cell lysates were subjected to Western blot analysis and β-actin was used as a loading control. Signal intensities of the proteins were quantified using NIH-Image software. Each column represents the mean with standard deviation (n = 3). Significant differences are indicated as **p < 0.01.

