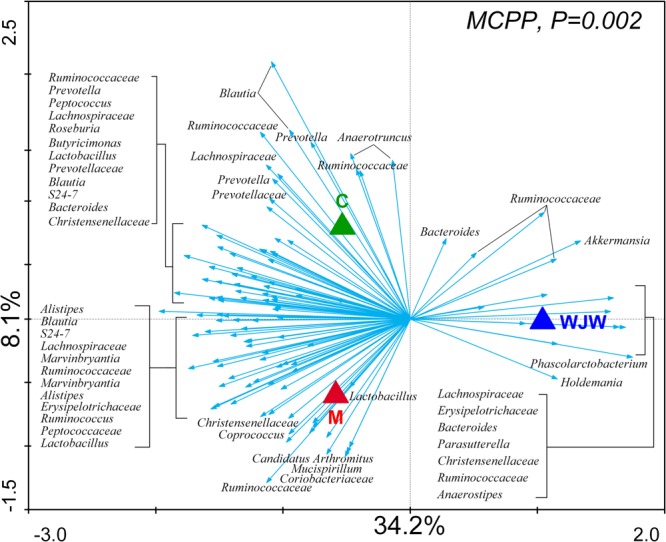
FIGURE 3.

Distance triplot of the RDA of the gut microbiota. Nominal environmental variables [C (blank control), M (model control), and WJW (Wuji Wan treatment)] are indicated by triangles. A total of 116 OTUs that had at least 42% of the variability in their values explained by the first two axes are indicated by arrows. The relative best-fit species are labeled with taxonomic names (genus or family names). Upper left, P-value obtained by MCPP.
