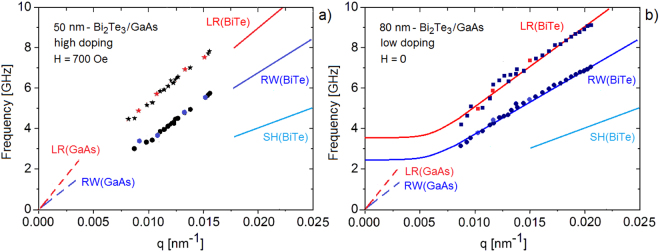
Figure 3.
(a) The BLS dispersion curves of RWs and LRs of the highly-doped 50 nm film (sample A) under a 700 Oe magnetic field: the measured branches do not show any anomaly and are quite similar to those in panel (b) for the thicker low-doped film (sample B) in the absence of magnetic field. Data points in color correspond to the spectra shown in Fig. 1(b,c). In panel (a) the experimental data are compared with the slopes of the RW and LR branches of Bi2Te3(111) (full lines) and of GaAs(001) (broken lines), while in panel (b) they are compared with a fit for the supported film where the q = 0 frequencies are scaled down by a factor 50/80 with respect to those of Fig. 2. The plots also show the calculated anomalies (thicker lines), which fall just below the observation range of present experiments and are reduced in size to almost one half of those for the 50 nm sample A. The shear horizontal (SH) mode of Bi2Te3 is also drawn (light blue line) in order to show that the RW is actually a pseudo-surface mode29.

