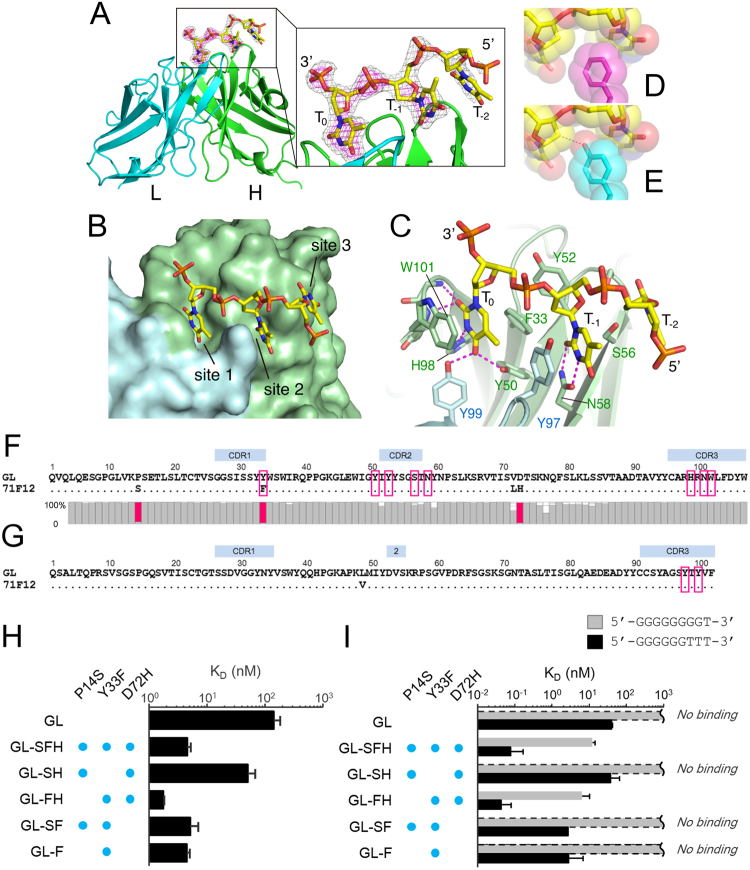
Figure 5.
Structural basis of the DNA recognition by 71F12. (A–C) Structure of the 71F12 Fab-DNA complex determined by crystallography. The DNA-binding sites (sites 1–3, B). Thymine bases (T0, T−1, and T−2, C). Hydrogen bonds are denoted by dashed magenta lines. (D and E) Replacement of F33 (D: magenta) with Y33 (E: cyan) would cause steric hindrance (dashed line). (F and G) Sequences of the 71F12 heavy chain (F) and light chain (G). The contacting residues are boxed. For the heavy chain, the conservation of each position from the HTS is shown below as gray bars, except for the three conserved mutations colored in red. (H and I) The 71F12 IgH-GL antibodies with indicated mutations were tested in SPR for the interaction with 5′-TTTTT-3′ (H), or 9-mer DNAs with the indicated sequences (I). The mean values of KD ± s.e.m. from three experiments are shown.

