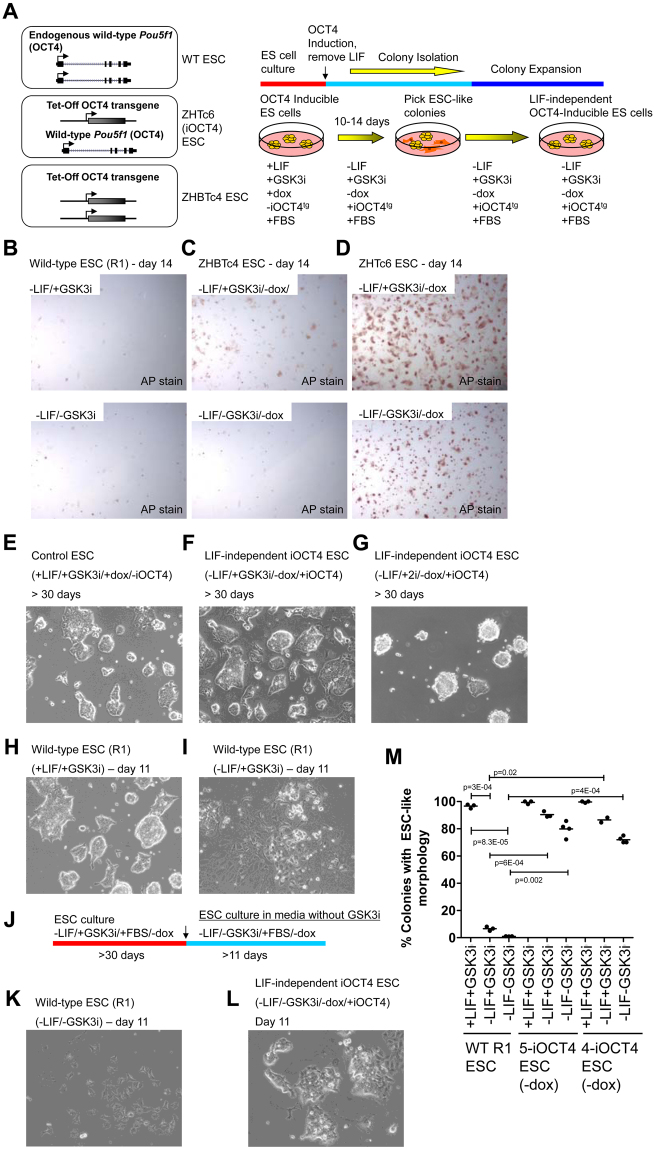
Figure 1.
OCT4 overexpression sustains ES cell self-renewal in the absence of LIF (A) Schematic of endogenous wild-type Pou5f1 (OCT4) alleles and the Tet-Off OCT4 transgene (left). Wild-type ES cells possess two endogenous wild-type Pou5f1 (OCT4) alleles, ZHTc6 (OCT4-inducible; iOCT4) ES cells contain one wild-type OCT4 allele and one Tet-Off OCT4 transgene, and ZHBTc4 ES cells contain two Tet-Off OCT4 transgenes. The Tet-Off OCT4 transgene is activated in the absence of doxycycline. Schematic of experimental design (right). ZHTc6 OCT4-inducible (iOCT4) ES cells5 were grown in ES cell media containing fetal bovine serum (FBS) but without LIF, with GSK3i and without doxycycline to induce OCT4 transgene overexpression (tg; transgenic). ESC-like colonies were picked and expanded in LIF-independent ES cell media. (B) AP staining of wild-type ES cells cultured in FBS-containing media, and with GSK3i (top) or without GSK3i (bottom). (C,D) AP staining of LIF-independent iOCT4 ES cells cultured in LIF-independent ES cell media containing FBS with GSK3i (top) or without GSK3i (bottom). (E–G) Bright-field microscopy of (E) control (ZHTc6) and (F,G) LIF-independent iOCT4 ES cells cultured in the presence of (E) LIF and GSK3i, (F) GSK3i or (G) GSK3i/MEKi. Wild-type ES cells (R1) cultured in (H) ES cell media containing FBS and LIF (+LIF/+GSK3i) or (I) without LIF (−LIF/+GSK3i). (J) Schematic of experimental design. iOCT4 ES cells were grown in LIF-independent ES cell media containing FBS and without doxycycline (−LIF/+GSK3i/+FBS/−dox) to induce OCT4 transgene overexpression for at least 30 days. iOCT4 and wild-type ES cells were subsequently cultured in LIF-independent ES cell media without LIF, GSK3i, or doxycycline (−LIF/−GSK3i/+FBS/−dox) for 11 days. (K) Wild-type ES cells cultured in FBS-containing media but without LIF or GSK3i. (L) iOCT4 ES cells cultured in FBS-containing media but without LIF or GSK3i, and without doxycycline. (M) ES cell colonies were scored by morphology. The percentage of colonies with an ES-like morphology (compact and round vs. flattened) are represented as mean ± SEM. P values were calculated using a t test.

