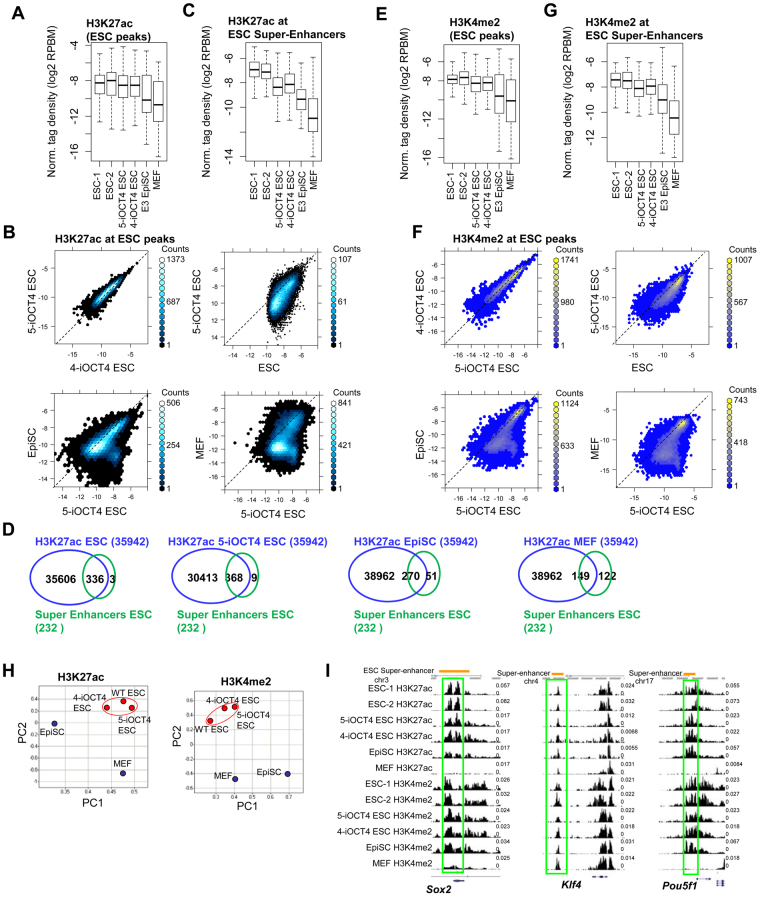
Figure 6.
Enhancer profiling of LIF-independent iOCT4 ES cells (A) Boxplot and (B) scatter plots of H3K27ac densities (log2 normalized tag density; RPBM) at ESC-peaks in control ES cells, LIF-independent iOCT4 ES cells, EpiSCs, and MEFs. (C) Boxplot H3K27ac density at ESC super-enhancers. (D) Venn diagrams showing overlap between H3K27ac and ESC super-enhancers in control ES cells, LIF-independent iOCT4 ES cells, EpiSCs, and MEFs. (E) Boxplot and (F) scatter plots of H3K4me2 densities at ESC-peaks. (G) Boxplot of H3K4me2 density at ESC super-enhancers. (H) Principal component analysis (PCA) of H3K27ac and H3K4me2 levels between LIF-independent iOCT4 ES cells, wild-type ES cells, EpiSCs, and MEFs. (I) Browser view of H3K27ac and H3K4me2 in control ES cells, LIF-independent iOCT4 ES cells, EpiSCs, and MEFs.

