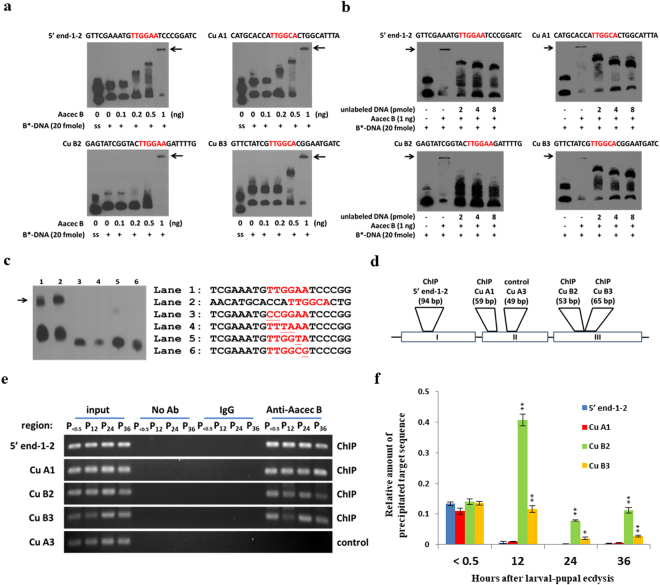
Figure 8.
The results of EMSA analyses and ChIP assay reveal that Aacec B peptide binding to the TTGG(A or C)A putative binding motifs of the four AaPPO 3 DNA fragments. (a–c) EMSA analysis results. The TTGGAA and TTGGCA putative motifs are indicated in red. The arrows point to the position of shifted bands. B*-DNA: Biotin-labeled DNA. ss: biotin labeling-single stranded DNA. (a) EMSA analyses showed that a shifted band was detected when each of the four AaPPO 3 DNA fragments containing TTGG(A or C)A putative binding motif were incubated with 1 ng Aacec B peptide. (b) Competition assays showed that the shifted bands of the four AaPPO 3 DNA fragments containing the TTGG(A or C)A putative binding motifs are able to be competed with when increasing concentrations of unlabeled DNA fragment (2 to 8 pmole) is added. (c) EMSA analysis showing that the shifted bands of two AaPPO 3 DNA fragments containing either the TTGG(A or C)A putative binding motif (indicated in red) can be detected (lanes 1 and 2), but no shifted band was detected after incubation with Aacec B peptide when the DNA fragments used contained nucleotide replacements within the TTGG(A or C)A motifs (indicated by single underline) (lanes 3–6). (d–f) The ChIP assay results. (d) Schematic representation of the ChIP and control primers is shown. Open boxes with roman numerals indicate exons. (e) ChIP assay on the four AaPPO 3 DNA fragments containing the TTGG(A or C)A putative binding motif. Aacec B antibody was used for the ChIP assay. No antibody (no Ab), normal rabbit IgG and Cu A3 DNA fragment were used in this experiment as negative controls. Three independent experiments were done with the similar results. Results from one experiment are shown. (f) qPCR of ChIP assay (e). qChIP results are presented as the mean of three independent experiments (n = 3; Mean ± SD). Asterisks indicate significant differences (*p < 0.005; **p < 0.001) from the signals from the TTGGAA motif within the 5′ end-1-2 DNA fragments at each time-point. Uncropped images are shown in Supplementary Figures S6 and S8. In (a), (b) and (c), similar results are seen in the other two independent experiments (see also Supplementary Figure S6b and S6c).

