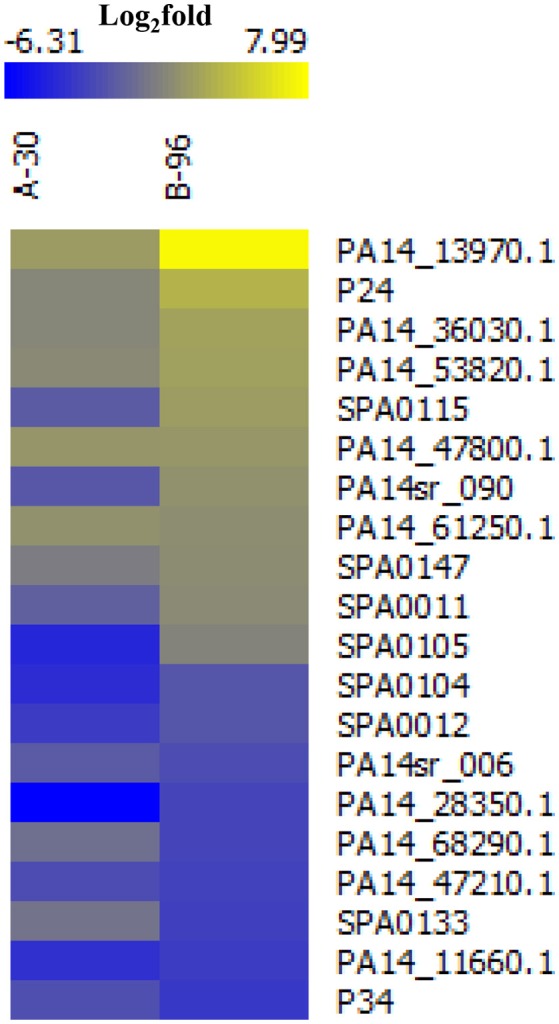
Figure 1.

Heat map of differentially abundant novel/annotated sRNAs under the conditions A-30 and B-96 when compared with condition P. The color code shown in the scale at the top denotes log2-fold changes. Blue and yellow indicate a decrease and an increase in the sRNA levels, respectively.
