
Figure 4.
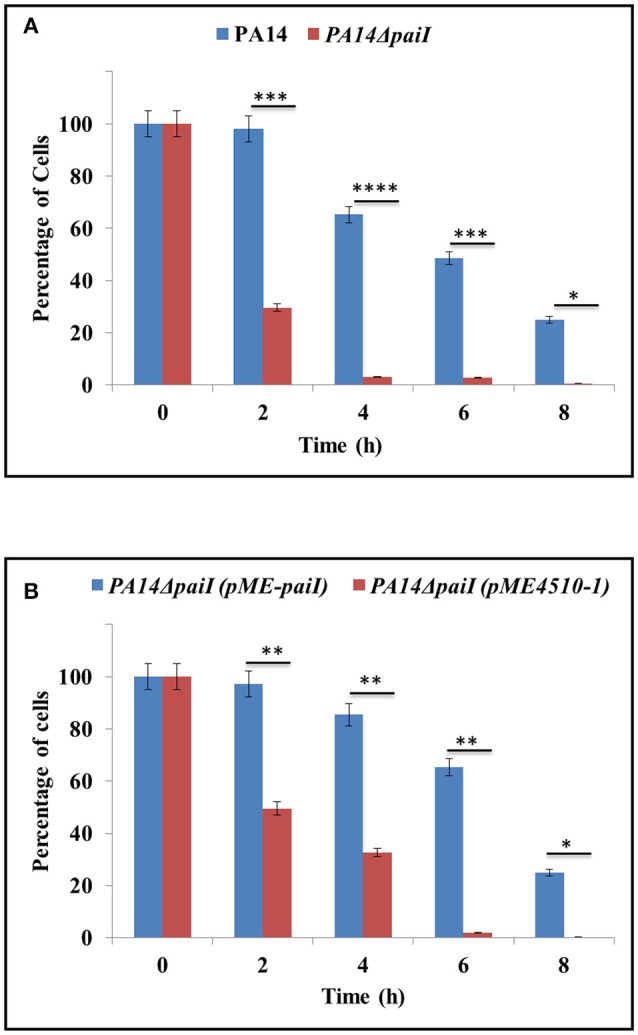
Anaerobic growth of PA14ΔpaiI. The strains were grown in BSM medium supplemented with 20 mM glucose. The CFU at time 0 (shift from aerobic to anaerobic conditions and concomitant addition of KNO3 to a final concentration of 100 mM) was set to 100%. The bars represent the percentage in CFU at either time relative to time 0. The CFU were obtained by plating serial dilutions of the cultures at the indicated times on LB plates. (A) Decline in the CFU of PA14 and PA14ΔpaiI after shift to anaerobiosis. (B) Decline in the CFU of PA14ΔpaiI (pME-paiI) and PA14 (pME4510-1) after shift to anaerobiosis. At time 0, IPTG was added to a final concentration of 2 mM to both cultures to induce transcription of the plasmid borne paiI gene in strain PA14ΔpaiI(pME-paiI). Depicted is mean ± SD, n = 3. Statistical analysis was performed using the unpaired student t-test (www.graphpad.com). ****p < 0.0001, ***p < 0.001, **p < 0.01, *p < 0.05.