
Figure 5.
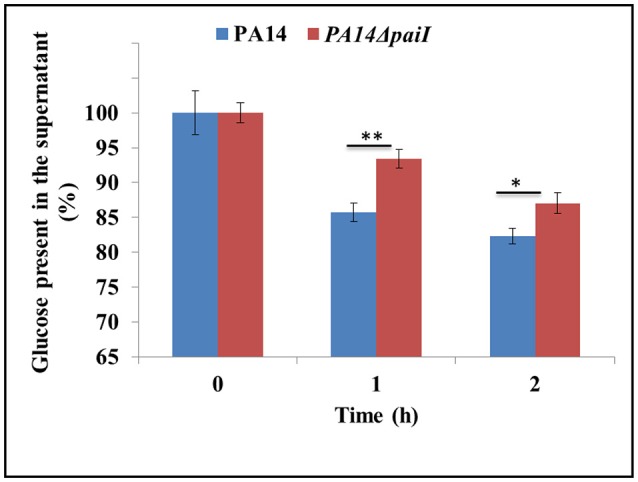
Reduced glucose uptake by strain PA14ΔpaiI. The amount of glucose present in the supernatant of PA14 and PA14ΔpaiI cultures was determined under the same conditions as described in the legend to Figure 4. The glucose concentration at time 0 (shift from aerobic to anaerobic conditions and addition of KNO3 to a final concentration of 100 mM) was set to 100%. The bars represent the percentage of glucose present at either time relative to time 0.). Depicted is mean ± SD, n = 9. Statistical analysis was performed using the unpaired student t-test (www.graphpad.com). **p < 0.01, *p < 0.05.