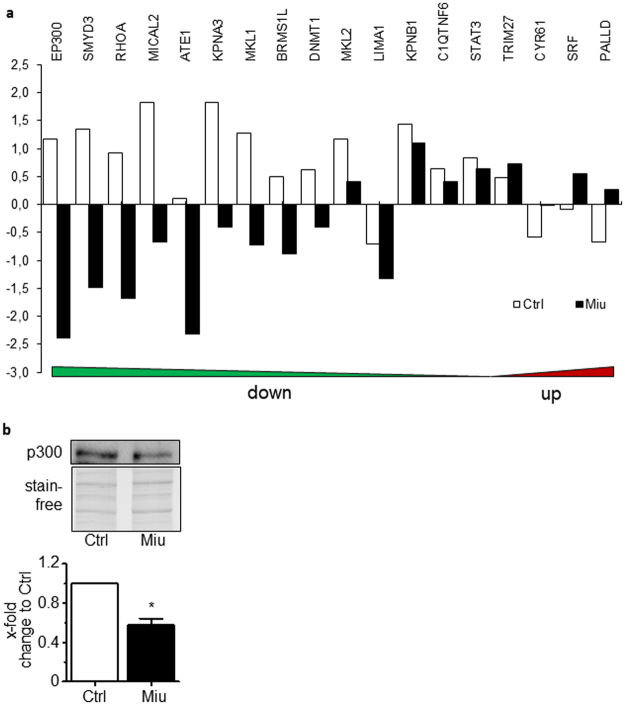
Figure 6.
Proteome analysis of MRTF-associated genes and expression of p300 transcription co-activator. SKOV3 cells were treated with 20 nM miuraenamide (Miu) for 56 h. (a) MRTF-associated genes were selected by GeneCards® Keyword Search “MRTF”. Miu treated cells (black bars) or harvested at stimulation start point without treatment (Ctrl, white bars) were depicted, log2 scale. b: Protein level of p300 in the Western blot (upper panel with stain free gel as loading control) and quantification (lower panel). One representative image per treatment is shown, n = 4. Paired two tailed t-test, *p < 0.05. The Western blot is cropped; the complete blot is displayed in the Supplementary materials.

