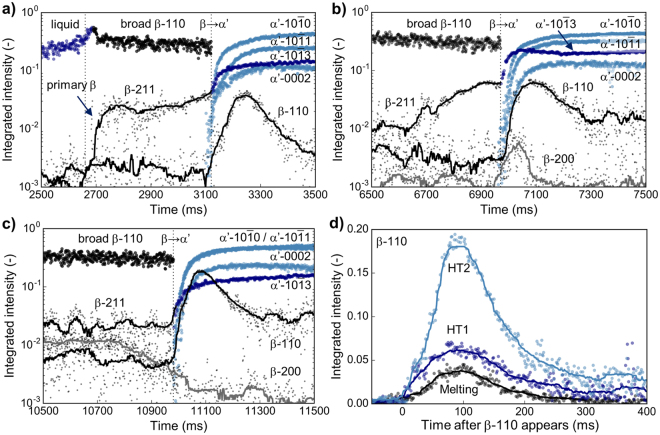
Figure 3.
Peak evolution upon rapid cooling The evolution of the integrated peak intensities is obtained by fitting the 1D diffractograms for every time point. For the melting cycle, β-Ti is obsereved after stable melt formation. Upon fast β → α′ transformation, the intensity of β-110 sharply increases before fading away (a). In HT1 weak diffraction spots from β-Ti are observed at high temperature. Upon β → α′ again β-110 and β-200 temporarily increase (b). For HT2 β is clearly observed throughout the high temperature period with a sharp rise in β-110 upon β → α′ (c). Comparison of the β-110 intensity shows increased diffraction intensity from melting over HT1 to HT2 with step-wise decreased energy input and temperature (d). Weak diffraction intensities from β-Ti are shown with a rolling median as visual guide.

