Figure 1.
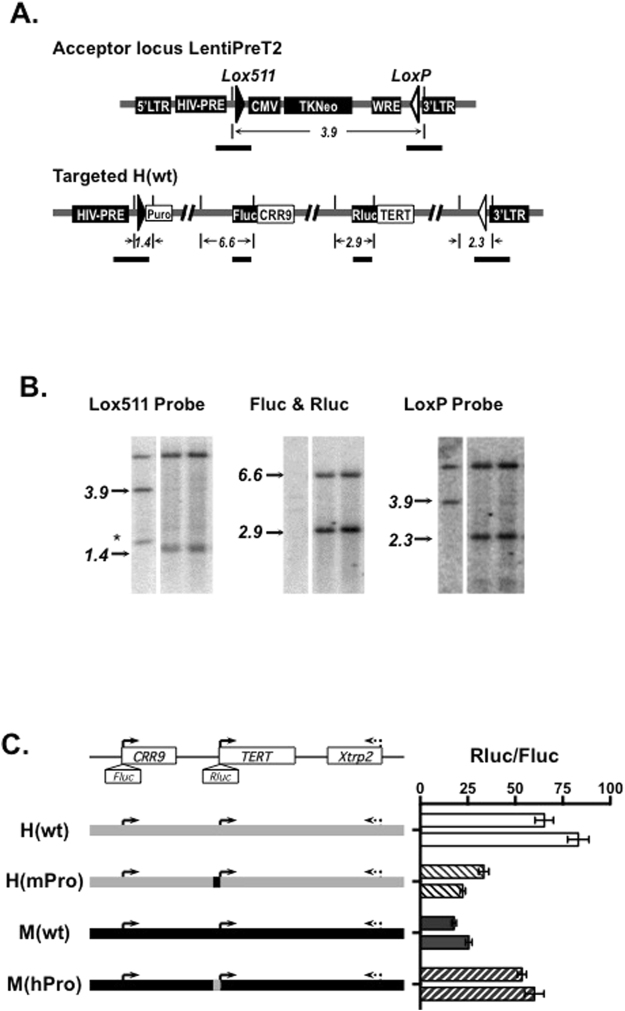
Chromosomal integration of BAC reporters. (A) Diagrams of chromosomal acceptor locus (top) and integrated BAC reporters (bottom). Lentiviral elements, selection markers, and luciferase reporters are shown as filled boxes. Lox sites are represented by triangles. Short vertical lines are Dra I sites and the numbers are sizes of restriction fragments in kilobases. Horizontal bars indicate positions of probes used in Southern blot analyses (see Table S1). (B) Southern analysis of RMBT clones. Genomic DNAs were extracted from acceptor cells (left lanes) and two clones containing H(wt) (middle and right lanes), digested with Dra I, and analyzed by Southern blotting using probes shown in A. Sizes of restriction fragments are indicated on the left of each panel. *, a band that was likely resulted from the presence of a Dra I site in a subset of the acceptor cells. The images were cropped from different parts of the same gel (see Supplementary info). (C) TERT promoter activities from BAC reporters in ESCs. Left, illustrations of wildtype and chimera BAC reporters. In H(wt) and M(wt), Fluc and Rluc cassettes were inserted at the initiation codons of CRR9 and TERT genes, respectively. Grey and black lines represent human and mouse genomic sequences, respectively. In H(mPro) and M(hPro), the TERT promoters were swapped between H(wt) and M(wt). Right, luciferase activities were measured in cells from 96-well plates. The TERT promoter activities are shown as Rluc/Fluc. Two clones for each BAC reporter were analyzed.

