
Figure 2.
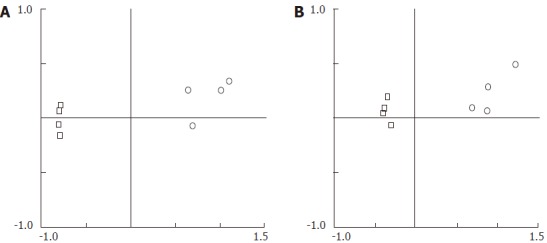
Principal component analysis plots for terminal restriction fragment length polymorphism profiles (including TRF size and relative abundance data). A: with AluI. B: with DdeI; Empty circle, eDNA; Empty square, iDNA.
Official websites use .gov
A
.gov website belongs to an official
government organization in the United States.
Secure .gov websites use HTTPS
A lock (
) or https:// means you've safely
connected to the .gov website. Share sensitive
information only on official, secure websites.
Principal component analysis plots for terminal restriction fragment length polymorphism profiles (including TRF size and relative abundance data). A: with AluI. B: with DdeI; Empty circle, eDNA; Empty square, iDNA.