Figure 2.

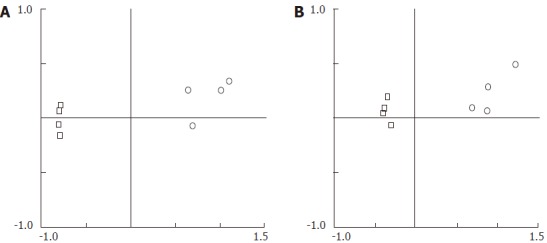
Principal component analysis plots for terminal restriction fragment length polymorphism profiles (including TRF size and relative abundance data). A: with AluI. B: with DdeI; Empty circle, eDNA; Empty square, iDNA.

Principal component analysis plots for terminal restriction fragment length polymorphism profiles (including TRF size and relative abundance data). A: with AluI. B: with DdeI; Empty circle, eDNA; Empty square, iDNA.