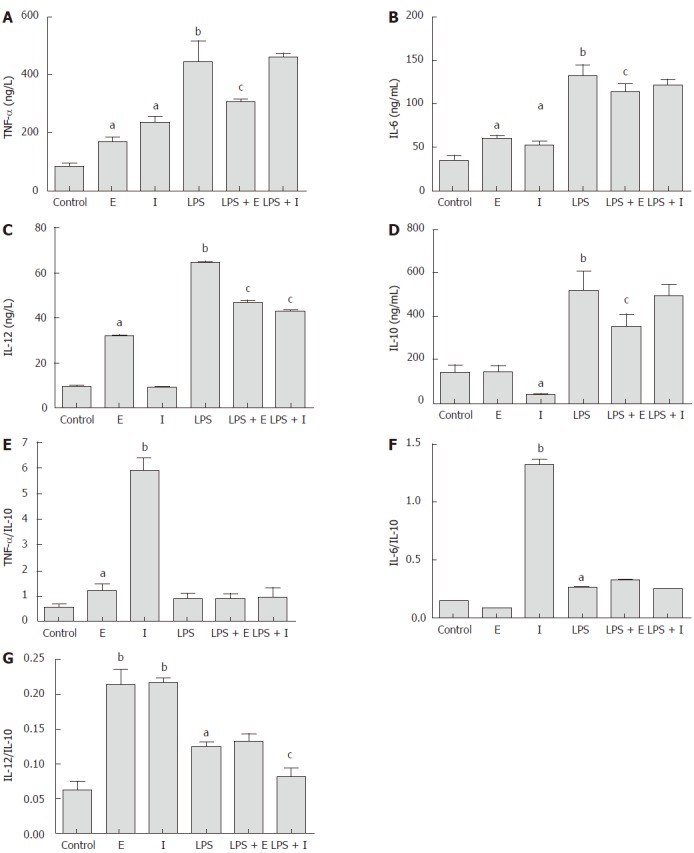
Figure 4.

Effect of iDNA and eDNA on cytokine production by Raw267.4 cells, including TNF-α (A), IL6 (B), IL-12 (C), IL-10 (D), and ratio of TNF-α (E), IL6 (F) and IL-12 (G) to IL-10. Cells were treated for 12 h with medium, lipopolysaccharide (LPS) (1 μg/mL), eDNA (1 ng/mL), iDNA (1 ng/mL), eDNA(1 ng/mL) + LPS (1 μg/mL), or iDNA (1 ng/mL) + LPS (1 μg/mL) for 12 h. Values are expressed as mean ± SEM (n = 6). aP < 0.05, Significant differences between control and treatment; bP < 0.01, significant differences between control and treatment; cP < 0.05, significant differences between LPS treatment and treatment. E: Extracellular bacterial DNA; I: Intracellular bacterial DNA; LPS: Lipopolysaccharide.
