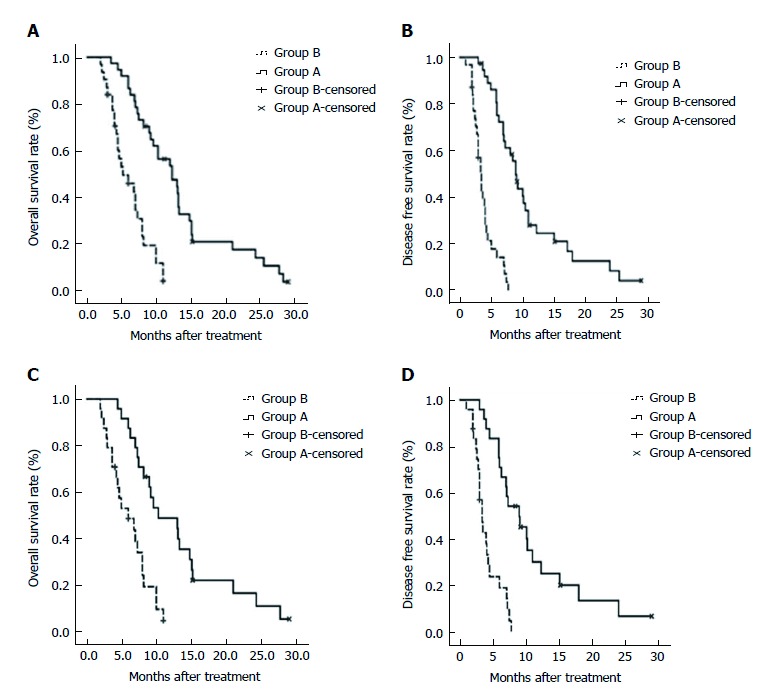
Figure 4.

Overall survival of the overall cohort and matched cohort. A: Kaplan-Meier curves for the overall patient cohort. OS differed between the two groups (OS, 12.3 vs 5.2 mo; P < 0.001); B: Kaplan-Meier curves for disease free survival in the overall patient cohort. C: Kaplan-Meier curves for OS in propensity score-matched patiens. Median OS was longer in group A than in group B (10.3 vs 6.0 mo; P < 0.001); D: Kaplan-Meier curves for disease free survival in propensity score-matched
