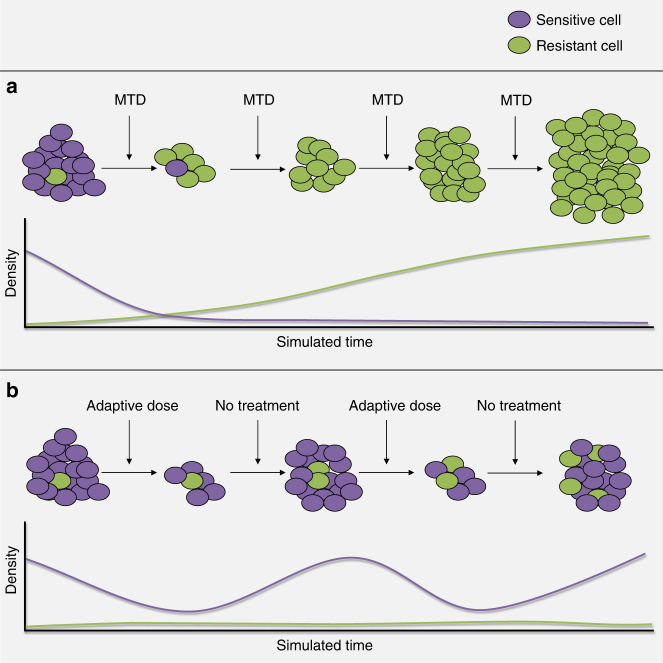
Fig. 1.
Illustration of the designed evolutionary dynamics in adaptive therapy. a,b The purple cells are sensitive to the treatment and the green cells are resistant. The graphs represent the simulated density of each population over time during treatment. The top row represents standard therapy in which the maximum tolerated dose is given continuously after initiation. The cells sensitive to treatment are eliminated quickly. This intensely selects for cells that are resistant to the treatment, in this case T− cells, and eliminates the competition effects of the T+ population, resulting in competitive release with rapid treatment failure and tumor progression. The bottom row represents an evolution-based strategy in which therapy is halted before all of the sensitive cells are eliminated. In the absence of therapy, the sensitive cells out-compete the resistant cells due to their fitness advantage. This “steers” the tumor back to the pretreatment so that it remains sensitive to treatment. The resistant cells, or T− population, will increase slightly with each cycle so that this treatment eventually fails. However, mathematical models demonstrate control may be durably maintained for up to 20 cycles - significantly longer than continuous therapy.

