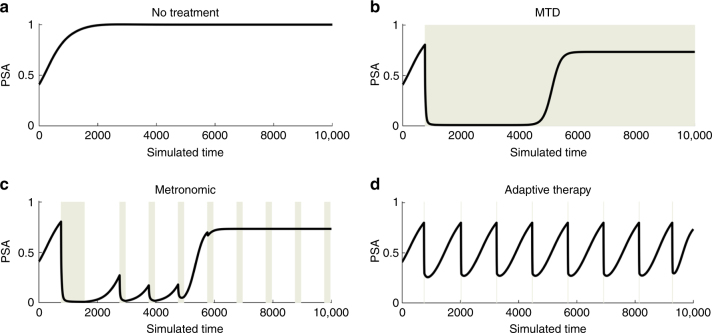
Fig. 3.
Computer simulations of PSA under varying treatment conditions. The gray background indicates administration of abiraterone in Patient #1. a demonstrates the PSA dynamics if no treatment was administered. b shows the classic PSA dynamics of maximal tolerated dose MTD, where a large response is maintained until PSA progression. c show the PSA dynamics for a metronomic therapy where treatment is not synchronized to patient-specific PSA dynamics. d shows the PSA dynamics of the clinical trial protocol, where PSA decreases to 50% of the baseline PSA and is allowed to return back to baseline before another dose of abiraterone is given

