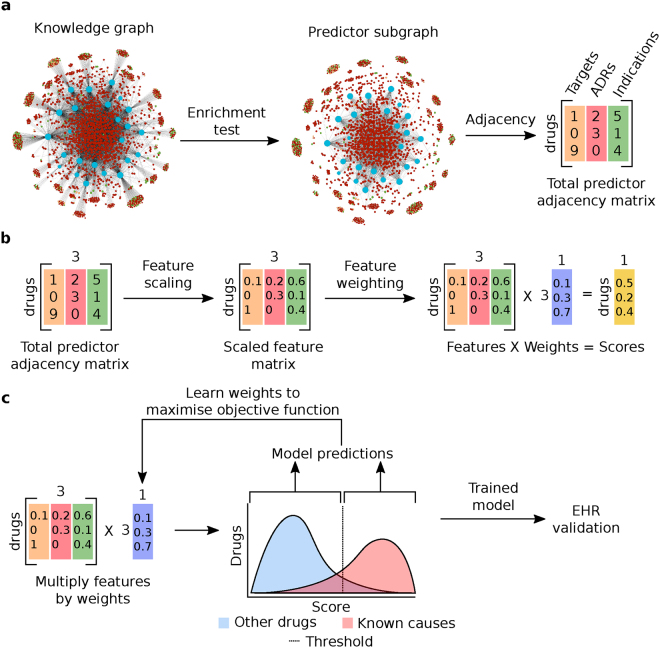
Figure 1.
Overview of the prediction algorithm. (a) Starting from a knowledge graph containing all publicly available information on the ADR being predicted, an enrichment test is used to identify predictive features of the drugs known to cause the ADR. The total adjacency of every drug with all predictors of each type (the columns of the matrix) is calculated from the graph. Blue nodes are drugs, red nodes are ADRs, orange nodes are targets, green nodes are indications. (b) The features (adjacency matrix from (a)) are scaled and weighted to produce a final score for every drug. (c) The optimum weight vector from (b) is learned from the knowledge graph to maximize an objective function. The predictions of this optimized model are tested in EHRs.

