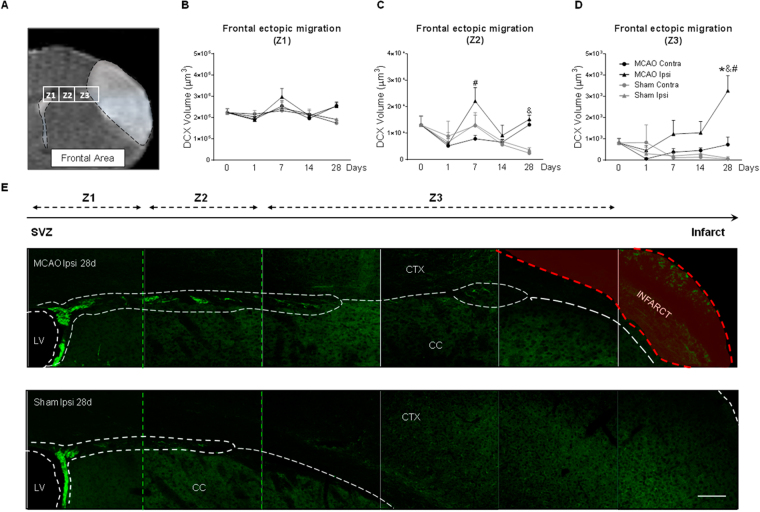
Figure 4.
Frontal ectopic neuroblast migration after stroke. (A) Regions analyzed from the SVZ toward the infarct (Z1, Z2, Z3). DCX+ volume in (B) Z1, (C) Z2 and (D) Z3. (E) Representative neuroblast migration images in MCAO and sham animals at 28d after stroke (scale bar: 100 µm). Naïve group was represented in figure as t = 0. No differences were observed when naïve and sham animals were compared. Data are presented as mean +/− SEM and compared by non-parametric 2-way ANOVA followed by Bonferroni post-hoc testing (Z2: F(1,14) = 2.94, #p = 0.0246, Ipsi MCAO vs. Contra MCAO; F(1,14) = 36.08, &p < 0.0001, MCAO vs. Sham; Z3: F(1,14) = 4.96, #p = 0.0429 Ipsi MCAO vs. Contra MCAO; F(1,14) = 11.15, &p = 0.0049 MCAO vs. Sham) and non-parametric 1-way ANOVA followed by Dunnett post-hoc testing (Z3: *p = 0.0099 MCAO vs. Naïve).

