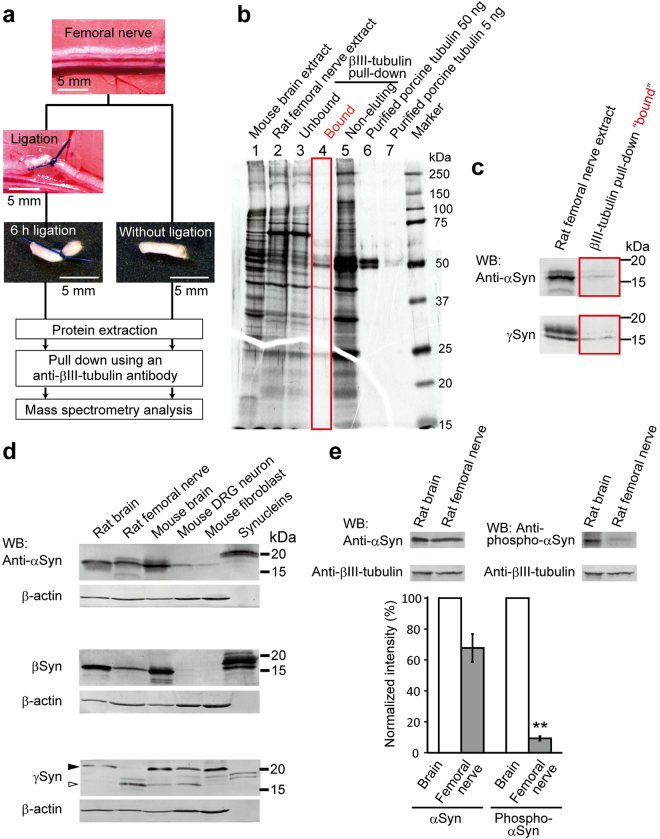
Figure 1.
αSyn and γSyn interact with βIII-tubulin in rat femoral nerves. (a) Schematic illustration of protein extraction from the rat femoral nerve. Under anesthesia, both sides of the rat femoral nerve roots were ligated to promote the accumulation of transported components at the ligated terminal. After 6 h of ligation, soluble proteins were extracted and subjected to a pull-down assay using an anti-βIII-tubulin antibody. After elution, the components were analyzed by LC-MS/MS. Scale bar: 5 mm. (b) Overview of silver staining with femoral nerve extraction. The eluted co-precipitates are indicated by the red square (lane 4). (c) Examination of co-precipitates by Western blotting (WB). According to the βIII-tubulin interactome obtained by LC-MS/MS analysis (Supplementary Fig. S1a), the co-precipitates were examined with anti-αSyn (upper) and anti-γSyn (lower) antibodies. (d) Expression profile of the three synucleins (Syns) examined in rat and mouse as indicated at the top. The filled arrowhead in the γSyn detection panel indicates phosphorylated γSyn, and the open arrowhead indicates unphosphorylated γSyn. Recombinant αSyn, βSyn and γSyn were loaded in the right-hand lane in each panel. β-actin was used as a loading control. (e) Phosphorylated αSyn in rat brain and femoral nerve. The expression of αSyn and phosphorylated αSyn was probed with anti-αSyn and anti-phospho-S129-αSyn antibodies, respectively. βIII-tubulin was used as a loading control. Quantification of the phosphorylation observed in 3 independent sets of experiments is shown in the lower panel. The signal intensity of αSyn or phospho-αSyn in brain was set at 100%. Data are presented as the mean ± SEM. **P < 0.01 by Student’s t-test. See also Supplementary Fig. S1.

