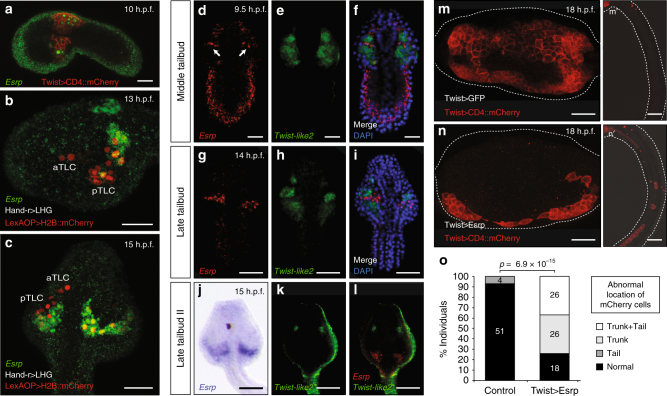
Fig. 2.
Esrp is expressed in a subpopulation of TLCs in Ciona and is able to modulate cell motility in the mesenchymal lineage. a Esrp expression (green) is detected at 10 h.p.f. by fluorescent WMISH in the epidermis and in some cells within the mesenchymal lineage, as shown by co-staining with mChe driven by the Twist promoter, which labels the Twist-like1-derived cell lineage. b, c Esrp (green) is expressed in the TLC lineage as shown by co-staining with Hand-r > LHG/LexAOP > H2B::mCherry (red) in 13 h.p.f. and 15 h.p.f. embryos in lateral b and dorso-lateral c views, respectively. aTLC: Anterior TLCs, pTLC: posterior TLCs. d–l Double fluorescent WMISH for Esrp (red) and Twist-like2 (green), with the exception of j, which corresponds to colorimetric Esrp mRNA staining (purple). At middle tailbud stage, Esrp expression is detected in both epidermis and mesenchymal cell lineage (the latter is marked by arrows). m-m’ Mesenchymal lineage in WT larvae at 18 h.p.f. stained in red using the Twist > CD4::mCherry construct. Twist > GFP was used as co-electroporation control plasmid, showing full co-electroporation (green channel not shown for clarity). n–n’ Mesenchymal lineage stained in larvae co-electroporated with Twist > CD4::mCherry and Twist > Esrp constructs. The trunk region is shown in m–n, while tail segments are shown in m’–n’. o Quantification of the different phenotypes of mesenchymal cell lineage motility observed in Twist > Esrp and control larvae. These included individuals with abnormal migration in the trunk (‘Trunk’), with ectopic mChe-positive cells in the tail (‘Tail’) or both phenotypes (‘Trunk + Tail’). P-values correspond to a two-sided Fisher Exact tests (‘Normal’ vs rest). Scale bars correspond to 25 µm

