Fig. 4.
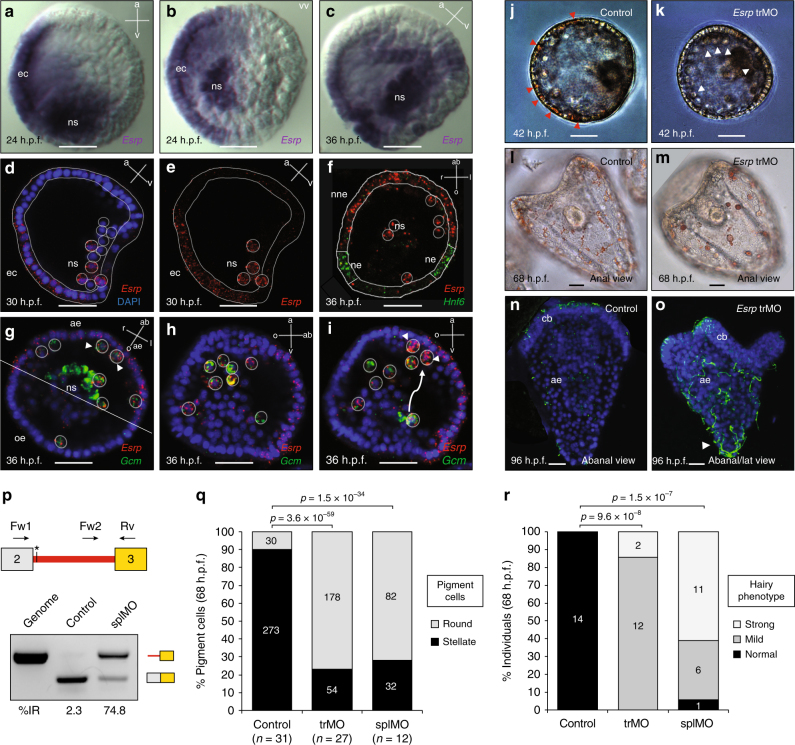
Esrp represses cilia formation in aboral ectoderm and is necessary for complete MET of pigment cells. a, b Colorimetric WMISH of Esrp in sea urchin embryos at 24 h.p.f., in lateral a and vegetal b views, showed expression in one side of the ectodermal territory (ec) and in some cells of the non-skeletogenic mesoderm (ns). vv, vegetal view. c Lateral view at 36 h.p.f. confirmed Esrp’s asymmetric expression in one side of the ns mesoderm. d, e Fluorescent WMISH at 30 h.p.f. (lateral view) confirmed ectodermal and mesodermal expression of Esrp. f Double fluorescent WMISH showed that Esrp expression (red) at 36 h.p.f. (animal pole view) did not overlap with the neurogenic ectoderm (ne) marker Hnf6 (green). nne, non-neural ectoderm. g Double fluorescent WMISH of Esrp (red) and Gcm (green) at 36 h.p.f. (animal pole view) revealed that Esrp was expressed in the aboral ectoderm (ae) and in the pigment cell precursors. Pigment cell precursors that are already in contact with the ectodermal epithelium are marked by arrowheads. oe, oral ectoderm. h, i Esrp (green) and Gcm (red) at 36 h.p.f. in two different stacks from same embryo (lateral view). The arrow indicates a representative migratory path of pigment cells from mesoderm to ectoderm. At the top right corner of each panel a–i, the orientation of the depicted embryo along the animal [a] - vegetal [v], oral [o] – aboral [ab], left [l] –right [r] axes are reported, when possible. j, k Early gastrula (42 h.p.f.) from uninjected control and Esrp trMO embryos showed differences in pigment cell location. Red/white arrowheads indicate pigment cells already integrated into the ectoderm or in the sub-ectodermal space, respectively. l, m Early pluteus larvae (68 h.p.f.) in abanal view show differences in pigment cell morphology upon trMO treatment (roundish instead of stellate/dendritic). n, o Ectopic embryonic cilia stained with acTubulin in the aboral ectoderm (ae) of 96 h.p.f. Esrp-trMO injected embryos. Apex is marked by a white arrowhead. cb, ciliary band. p RT-PCRs showing the levels of intron 2 retention in Esrp transcripts from control and Esrp splMO embryos; genomic DNA was used as a reference for intron inclusion. The asterisk marks the position of the first in-frame termination codon in intron-retained transcripts. q Quantification of pigment cell morphology in control, Esrp trMO and splMO knockdown 68 h.p.f. embryos (sum of three independent experiments). r Quantification of the ‘hairy’ phenotype in control, Esrp trMO and spMO knockdown 68 h.p.f. embryos (sum of two independent experiments). P-values correspond to 2-way q or 3-way r two-sided Fisher Exact tests. Hairy phenotype was considered “mild” when aboral ectoderm cells show long cilia (of similar or longer length than ciliary band cells) and “strong” when, in addition to the latter, larvae show particularly long cilia at the apex, as indicated by an arrowhead in panel o. Scale bars correspond to 20 µm

