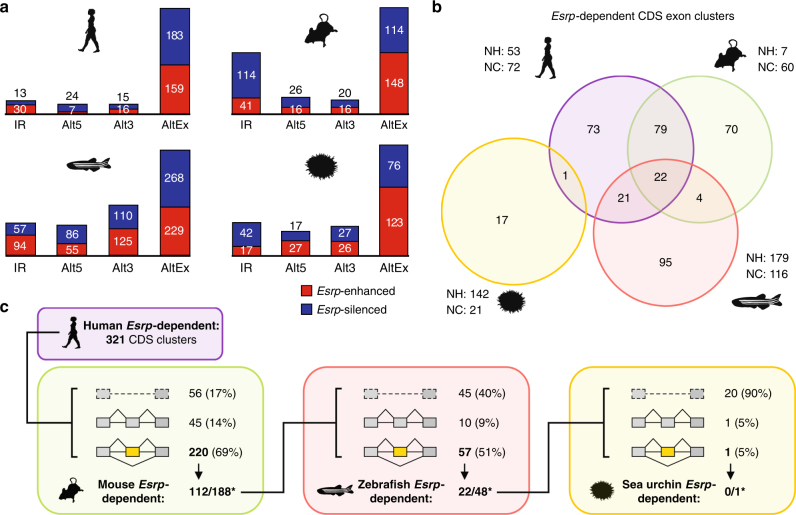
Fig. 5.
Evolution of Esrp-dependent splicing programs. a Number Esrp-dependent AS events by type detected in human, mouse, zebrafish and sea urchin, RNA-seq samples. Red/blue bars correspond to Esrp-enhanced/silenced inclusion of the alternative sequence. IR, intron retention; Alt5, alternative 5′ splice site choice; Alt3, alternative 3′ splice site choice; AltEx, alternative cassette exons. b Venn diagram showing the overlap among homologous Esrp-dependent cassette exons in coding regions detected as regulated in the same direction in the studied species. Only Esrp-dependent exons with homologs in at least two species and sufficient read coverage in all the species in which they have homologs are included in the comparison. Esrp-dependent exons that lack homologous counterparts in all the other species are indicated for each species (NH). Similarly, the number of Esrp-dependent exons that do not have sufficient read coverage in at least one of the species with a homologous exon is displayed for each species (NC). c Summary of conservation at the level of genomic presence, alternative splicing and Esrp-dependency for all 321 clusters of human Esrp-dependent coding exons in other species. Shared Esrp-dependent exons between the previous phylogenetic group are classified in the test species into three categories: (i) the exon is not detected in the genome (top row, discontinuous line); (ii) the homologous exon is detected in the genome, but it is constitutively spliced (middle row, gray exon); and (iii) the homologous exon is alternatively spliced (bottom row, yellow exon, numbers in bold). Below this classification, the number of similarly regulated Esrp-dependent exons shared by the two species/lineages over the number of alternatively spliced exons with sufficient read coverage from (iii) (indicated by asterisks), is shown

