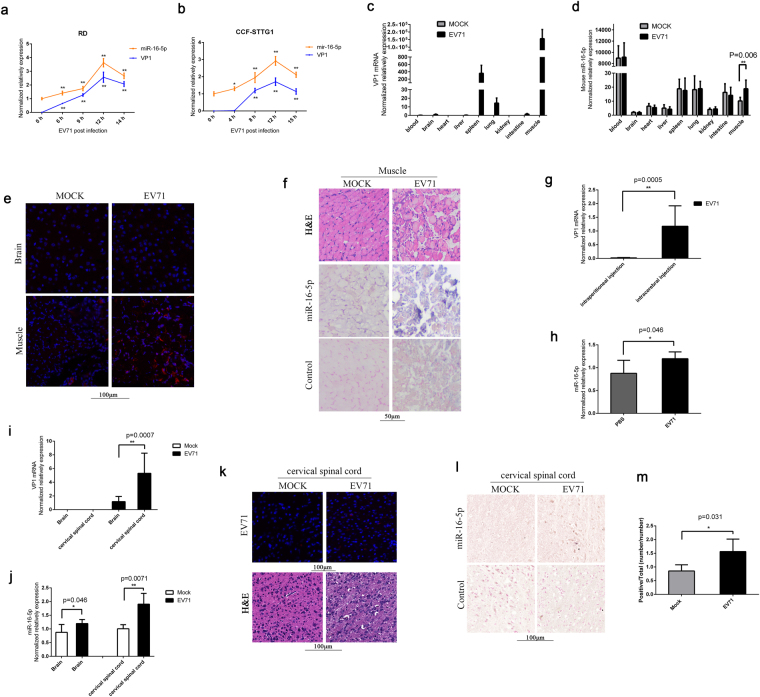
Figure 1.
Expression levels of miR-16-5p in EV71-infected RD, CCF-STTG1 cells and EV71-infected mouse tissues. (a,b) The expression levels of hsa-miR-16-5p and EV71 VP1 gene were quantified by qRT-PCR after EV71 infection for 0, 6, 9, 12 and 14 (RD cells) or 0, 4, 8, 12 and 15 h (CCF-STTG1 cells). U6 rRNA was used as an internal control for the expression miR-16-5p. GAPDH was measured as a control for the expression of EV71 VP1gene. Values are means from triplicate experiments and represent the relative levels of expression in RD (a) and CCF-STTG1 (b) cells. The differences between 0 h and the other time points have been evaluated by statistical analysis respectively. (c,d) The expression of mmu-miR-16-5p was measured in EV71-infected mice. Two-week old KM mice (about 7–9 g) were intraperitoneally injected with 1 × 10⁵ TCID50 EV-A71 GZ-CII. After three to four days, the mice were sacrificed after appearing serious posterior paresis. The whole blood and different tissues from sacrificed mice were harvested for RNA extraction. The expression levels of the EV-A71 GZ-CII gene was quantified by qRT-PCR with specific primers for VP1 genes and with mouse GAPDH as an internal control (c). The expression of mmu-miR-16-5p was determined in different tissues (d). The relative expression levels of the target genes were calculated according to the 2−∆∆Ct method. (e) Detection of EV71 replication in EV71-infected brain and muscle tissues by immunofluorescent histochemical staining with a specific anti-EV71 VP1 protein antibody (the red signals represent EV71 VP1 protein). (f) Hematoxylin and eosin staining of EV71-infected and mock-infected muscle tissue (upper panels).The expression levels of mmu-miR-16-5p in EV71-infected mock-infected muscle tissues were detected by in situ hybridisation (lower panels). (g) The expression levels of the EV-A71 GZ-CII gene in brain from the mice infected with virus through two different ways of injection were quantified by qRT-PCR. Two group of two-week old KM mice (about 7–9 g), one group were intraperitoneally injected with 1 × 10⁵ TCID50 EV-A71 GZ-CII and the other group were intracerebrally injected with 1 × 10³ TCID50 EV-A71 GZ-CII. After three to four days, the mice were sacrificed after appearing serious posterior analysis and the brains were separated for expression analysis. (h) Analysis the expression of mmu-miR-16-5p in brain from intracerebrally injected mice. Two group of two-week old KM mice (about 7–9 g), one were intracerebrally injected with 1 × 10³ TCID50 EV-A71 GZ-CII and the other group were intracerebrally injected with equal volume of PBS (5 μL). The mice were sacrificed and the brains were separated for expression analysis. (i,j) Analysis the expression of EV-A71 GZ-CII and mmu-miR-16-5p in whole brain and in cervical spinal cord from EV-A71 GZ-CII infected mice. After intracerebral injection with EV-A71 GZ-CII, the mice were sacrificed. The whole brain and cervical spinal cord were separated for expression analysis. The expression of EV-A71 GZ-CII (i) and mmu-miR-16-5p (j) were quantified by qRT-PCR. (k) The cervical spinal cords were separated from intracerebrally infected mice and were blocked in paraffin. The expression of EV-A71 GZ-CII was analysed by fluorescence immunohistochemistry with a specific anti-EV71 VP1 protein antibody (the red signals represent EV71 VP1 protein) (upper panels). The cervical spinal cords form EV-A71 GZ-CII infected and mock infected mice were stained by Hematoxylin and eosin (lower panels). (l,m) The expression of mmu-miR-16-5p in cervical spinal cords form EV-A71 GZ-CII intracerebrally infected mice were analysis by in situ hybridisation (l). Image analyses were undertaken using Aperio ImageScope Software (v10) and the Positive Pixel Count V9 algorithm (default settings) (m). The data represent mean ± SD and were analyzed by Student’s t test. Asterisks denote significant differences between indicated samples (*p < 0.05, **p < 0.01).

