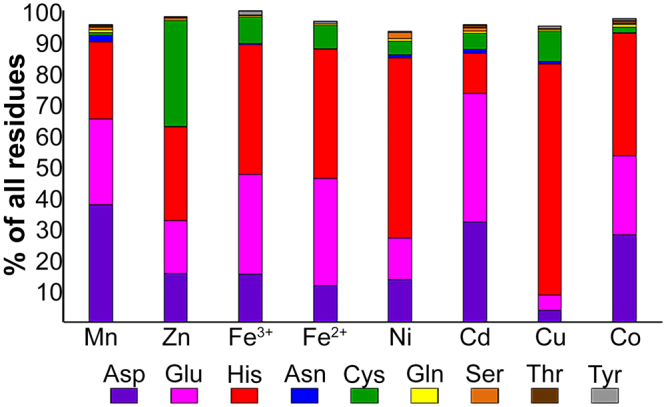
Figure 3.

Selected amino acid propensities of the different metals. For each metal, the percentage of each residue is defined as the number of times that a specific residue was bound to the metal divided by the number of all residues bound to the metal. The different residues are presented in different colors: Aspartate in purple, glutamate in pink, histidine in red, asparagine in blue, cysteine in green, glutamine in yellow, serine in orange, threonine in brown and tyrosine in gray.
