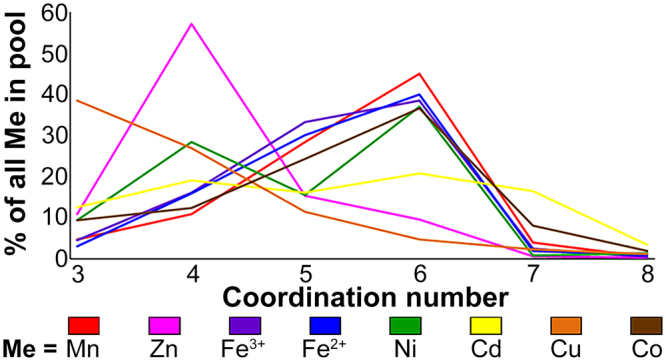
Figure 4.

Main coordination number distribution of the different metals. For each metal, the percentage of each coordination number (CN, 3 to 8) is defined as the number of times the metal was bound in a specific CN divided by the total number of this metal in the statistics (in all coordination numbers, based on the data in Supplementary Table S2). Every metal is presented in different color: Manganese in red, zinc in pink, ferric in purple, ferrous in blue, nickel in green, cadmium in yellow, copper in orange and cobalt in brown.
