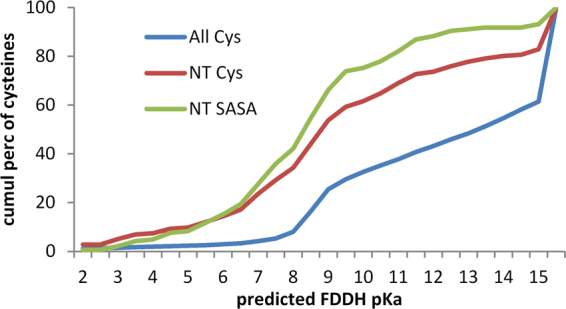
Figure 2.

Predicted pKas of cysteines in the hu1627 dataset. Three subsets of cysteines are shown in plots of cumulative percentage distributions: all cysteines in these structures (All Cys, 8559), only Cys located at the first position in an α-helix (NT Cys, 216), and the NT subset further restricted to include only those with SASA > 0.1 Å2 (NT SASA Cys, 145). Each set contains cysteines that have predicted pKas > 15. These tend to arise for buried groups with high desolvation penalties, and are accordingly less evident for the NT SASA Cys set.
