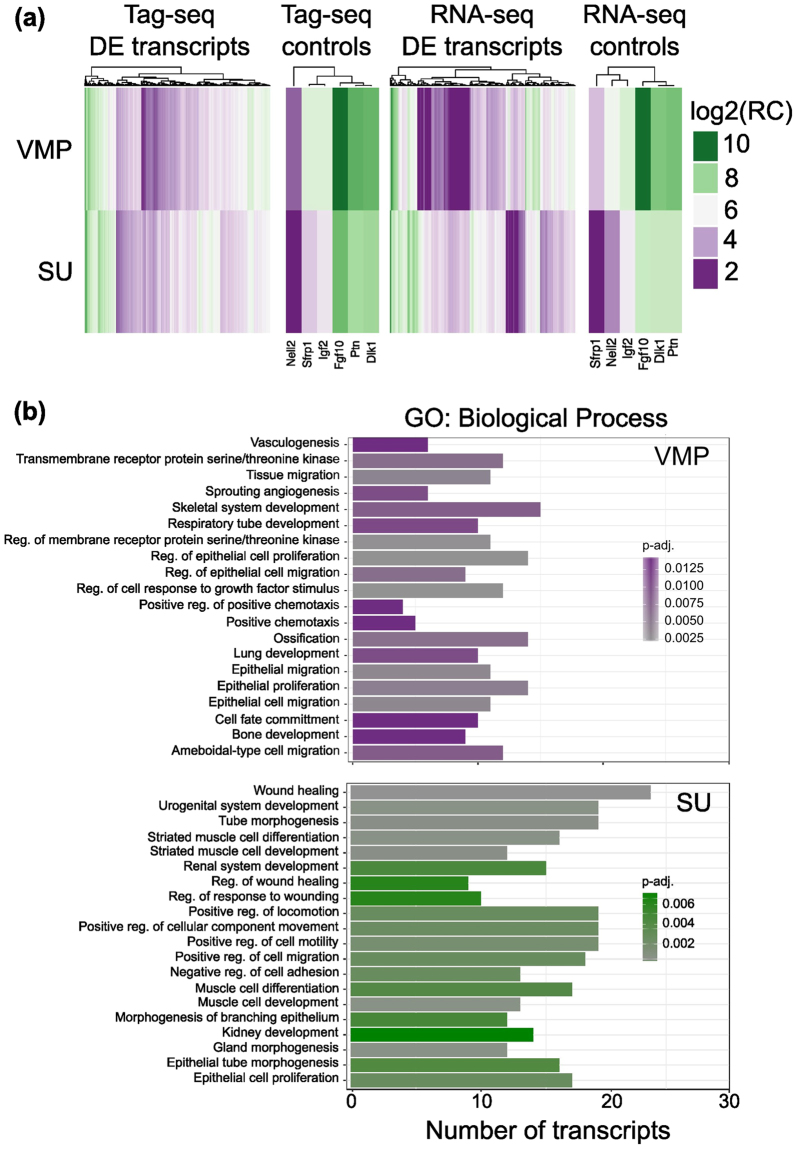
Figure 2.
Differential expression of transcripts between VMP and SU, and Gene Ontology of pathways associated with tissue subsets. (a) Heatmap representing expression values of the 400 differentially expressed transcripts (M ≥ 1.5 and q > 0.9) between VMP and SU identified by both Tag-seq and RNA-seq, as well as previously published markers of VMP (Nell2, Sfrp1, Igf2, Fgf10, Ptn, Dlk1). The colour key represents log2-trimmed mean of M component normalized read counts (log2(RC)). Both Tag-seq and RNA-seq identified transcripts showing differential expression between SU and VMP (b) Gene ontology analysis of VMP and SU enriched transcripts. The figure shows the biological process group found with an FDR adjusted P-value < 0.05. Bar length represent the number of VMP and SU enriched transcripts in each group and the shade of colour the adjusted P-value for the enrichment. VMP showed enrichment of pathways related to regulation of epithelial proliferation, migration and response to growth factors, while the SU showed enrichment of pathways related to muscle development consistent with its tissue composition.

